Feature
April | 6-2021
Past stimulus efforts that provided economic relief to individuals helped to prevent more Americans from slipping deeper into poverty than might have been the case otherwise. The recently passed $1.9 trillion pandemic relief legislation contains elements that could lift many Americans out of poverty and could cut the number of children living in poverty by more than half. No-strings-attached federal payments to families with children will play a significant role in that effort.
COVID-19 has affected the employment and economic security of many families in the United States and globally in ways we don’t yet fully understand. According to the federal definition, the number of children living in poverty in the United States in 2015 was about 9.6 million, or 13% of all children. That’s roughly equal to the entire population of Michigan. More than 2.1 million of them—3% of U.S. children—live in families facing deep poverty, having income less than half the poverty line. But these averages mask a lot of variation.
There are many reasons why child poverty rates vary a lot by race and ethnicity, family structure, and national origin of parents. The ongoing impact of structural and systemic racism, nativism and other forms of discrimination contributes to African American children and Hispanic children having consistently higher poverty rates than non-Hispanic White children (18% and 22%, respectively, compared with just 8%). Poverty rates among Native American children also appear to be much higher, but precise estimates are unavailable.
Family structure matters, too, because families headed by just one parent may face extra obstacles like finding and paying for reliable childcare, as well a lack of reliable child support from non-custodial parents. Thus, it is not surprising that children in single-parent families are more than twice as likely to live in poverty compared with children in two-parent families. Where parents were born also affects child poverty. Twice as many children in immigrant families are poor compared to those in nonimmigrant families (21% vs. 10%). Region of residence also matters; the southern United States has some of the highest child poverty rates.
These are among the results in a 2019 report requested by Congress and released by the National Academies called A Roadmap to Reducing Child Poverty. Report authors outline the scope of child poverty and present four packages of policy and program changes, two of which can reduce child poverty and deep poverty by half within 10 years, an ambitious goal but one that the United States has accomplished in the past.
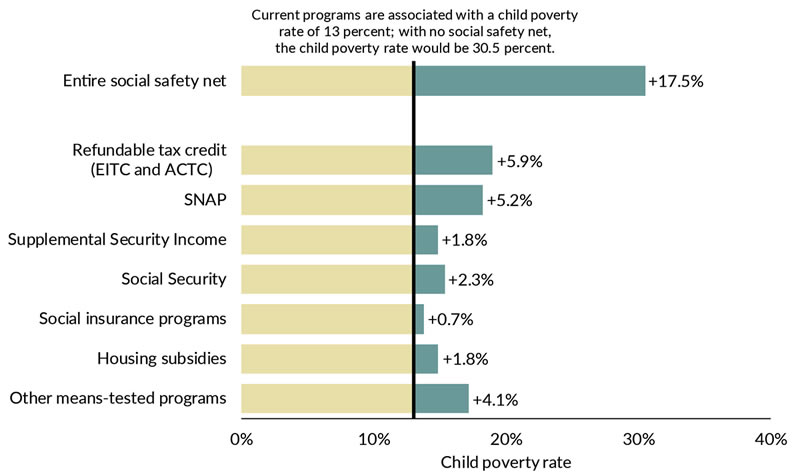
Source: Estimates commissioned by the NASEM consensus committee, using the Supplemental Poverty Measure with the Current Population Survey Annual Social and Economic Supplement, with income adjusted for underreporting.
Policy/practice implications
A nonpartisan National Academies committee devised two packages of policies and programs that would cut child poverty in half while boosting income and employment. The packages cost much less than the current estimated societal costs of child poverty. See the figure below for a side-by-side comparison of the two packages.
Policy Package #1: Means-tested supports and work
Expands four existing programs
- Increase Earned Income Tax Credit (EITC) payments for the lowest-income families.
- Convert the Child & Dependent Care Tax Credit (CDCTC) to a fully refundable tax credit and concentrate its benefits on families with the lowest incomes and with children under age 5.
- Increase Supplemental Nutrition Assistance Program (SNAP) benefits by 35% and increase benefits for older children.
- Increase the number of housing vouchers directed to families with children so that 70% of eligible families that are not currently receiving subsidized housing would use them.
Estimated cost of package: $90.7 billion per year
Net change in earnings: $2.2 billion
Net change in jobs: +404,243
Policy Package #2: Universal supports and work
Combines work incentives, economic security, and social inclusion
- Increase EITC payments by 40% across the entire tax schedule, keeping the current range of credit phase-out.
- Convert the CDCTC to a fully refundable tax credit and concentrate its benefits on families with the lowest incomes and with children under age 5.
- Raise the current federal minimum wage ($7.25 per hour since 2009) to $10.25 and index it to inflation after it is implemented.
- Restore eligibility for SNAP, Temporary Assistance for Needy Families (TANF), Medicaid, Supplemental Security Income (SSI), and other means-tested federal programs for legal immigrants.
- Institute a new child allowance that pays a monthly benefit of $225 per month ($2,700 per year) to families of all children under age 17. This child allowance would also be paid to currently nonqualified legal immigrants.
- Institute a child support assurance policy to provide a backup source of income if a parent does not pay child support and setting guaranteed minimum child support of $100 per month per child.
Estimated cost of package: $108.8 billion per year
Net change in earnings: $13.4 billion
Net change in jobs: +611,182
| Means-tested supports & work package | Universal supports & work package | ||
| Work-oriented programs and policies |
Expand EITC | ||
| Expand Child Tax Credit | |||
| Increase minimum wage | |||
| Income support-oriented programs and policies |
Expand housing voucher program | ||
| Expand SNAP benefits | |||
| Begin child allowance | |||
| Begin child support assurance | |||
| Eliminate 1996 immigration restrictions | |||
| Economic impact | Estimated cost (billions of dollars) | $90.7 | $108.8 |
| Net change in earnings (billions of dollars) | $2.2 | $13.5 | |
| Net change in jobs | +404,243 | +611,182 |