- April 2020
- Fast Focus Research/Policy Brief No. 47-2020
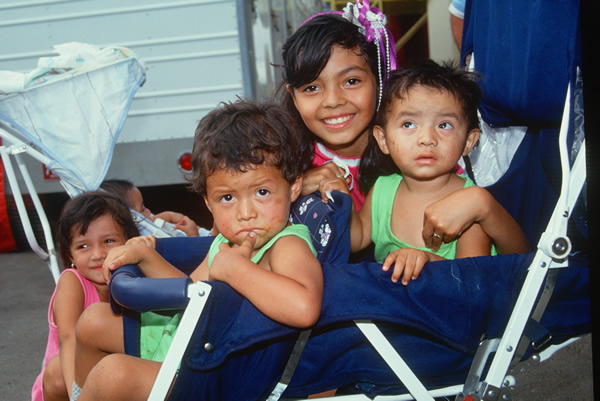
The number of U.S. children living in poverty is about 9.6 million, which is roughly equal to the entire population of Michigan, and equals 13% of all children. More than 2.1 million children—3% of all children—live in families that are in deep poverty, having incomes below half the poverty line. But these averages mask substantial variation.
Child poverty rates vary a lot by race and ethnicity, family structure, immigration status, and geography. African American children and Hispanic children have consistently higher poverty rates than non-Hispanic white children (18% and 22%, respectively, compared with just 8%). Poverty rates among Native American children also appear to be much higher, but precise estimates are unavailable.
Family structure matters, too. Although 22% of children in single-parent families live in poverty, only 9% of children in two-parent families are poor. In addition, nativity affects child poverty. Twice as many children in immigrant families are poor than those in nonimmigrant families (21% vs. 10%).[1]
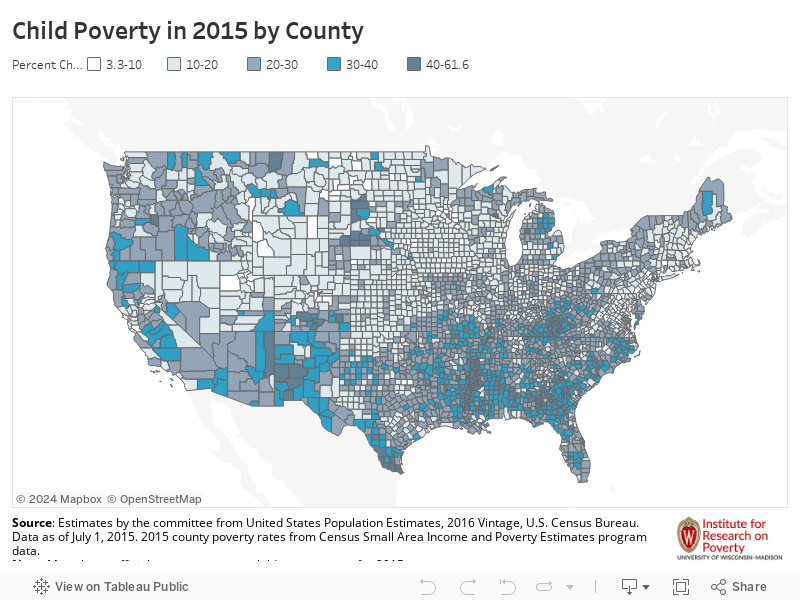
Region of residence can affect child poverty rates as well. The Southern U.S. has some of the highest child poverty rates in the nation. (See Map 1 interactive for child poverty rates by county.)
Map 1. Child poverty varies a lot by where families live. Click on a county for its 2015 child poverty rate.
These are among the results in a recent report requested by Congress and released by the National Academies called A Roadmap to Reducing Child Poverty. Report authors outline the scope of child poverty using a measure that counts a wide range of resources and expenses.[2] They also present packages of policy and program changes, two of which can reduce child poverty and deep poverty by half within 10 years–an ambitious goal but one that the U.S has accomplished in the past (Figure 1).
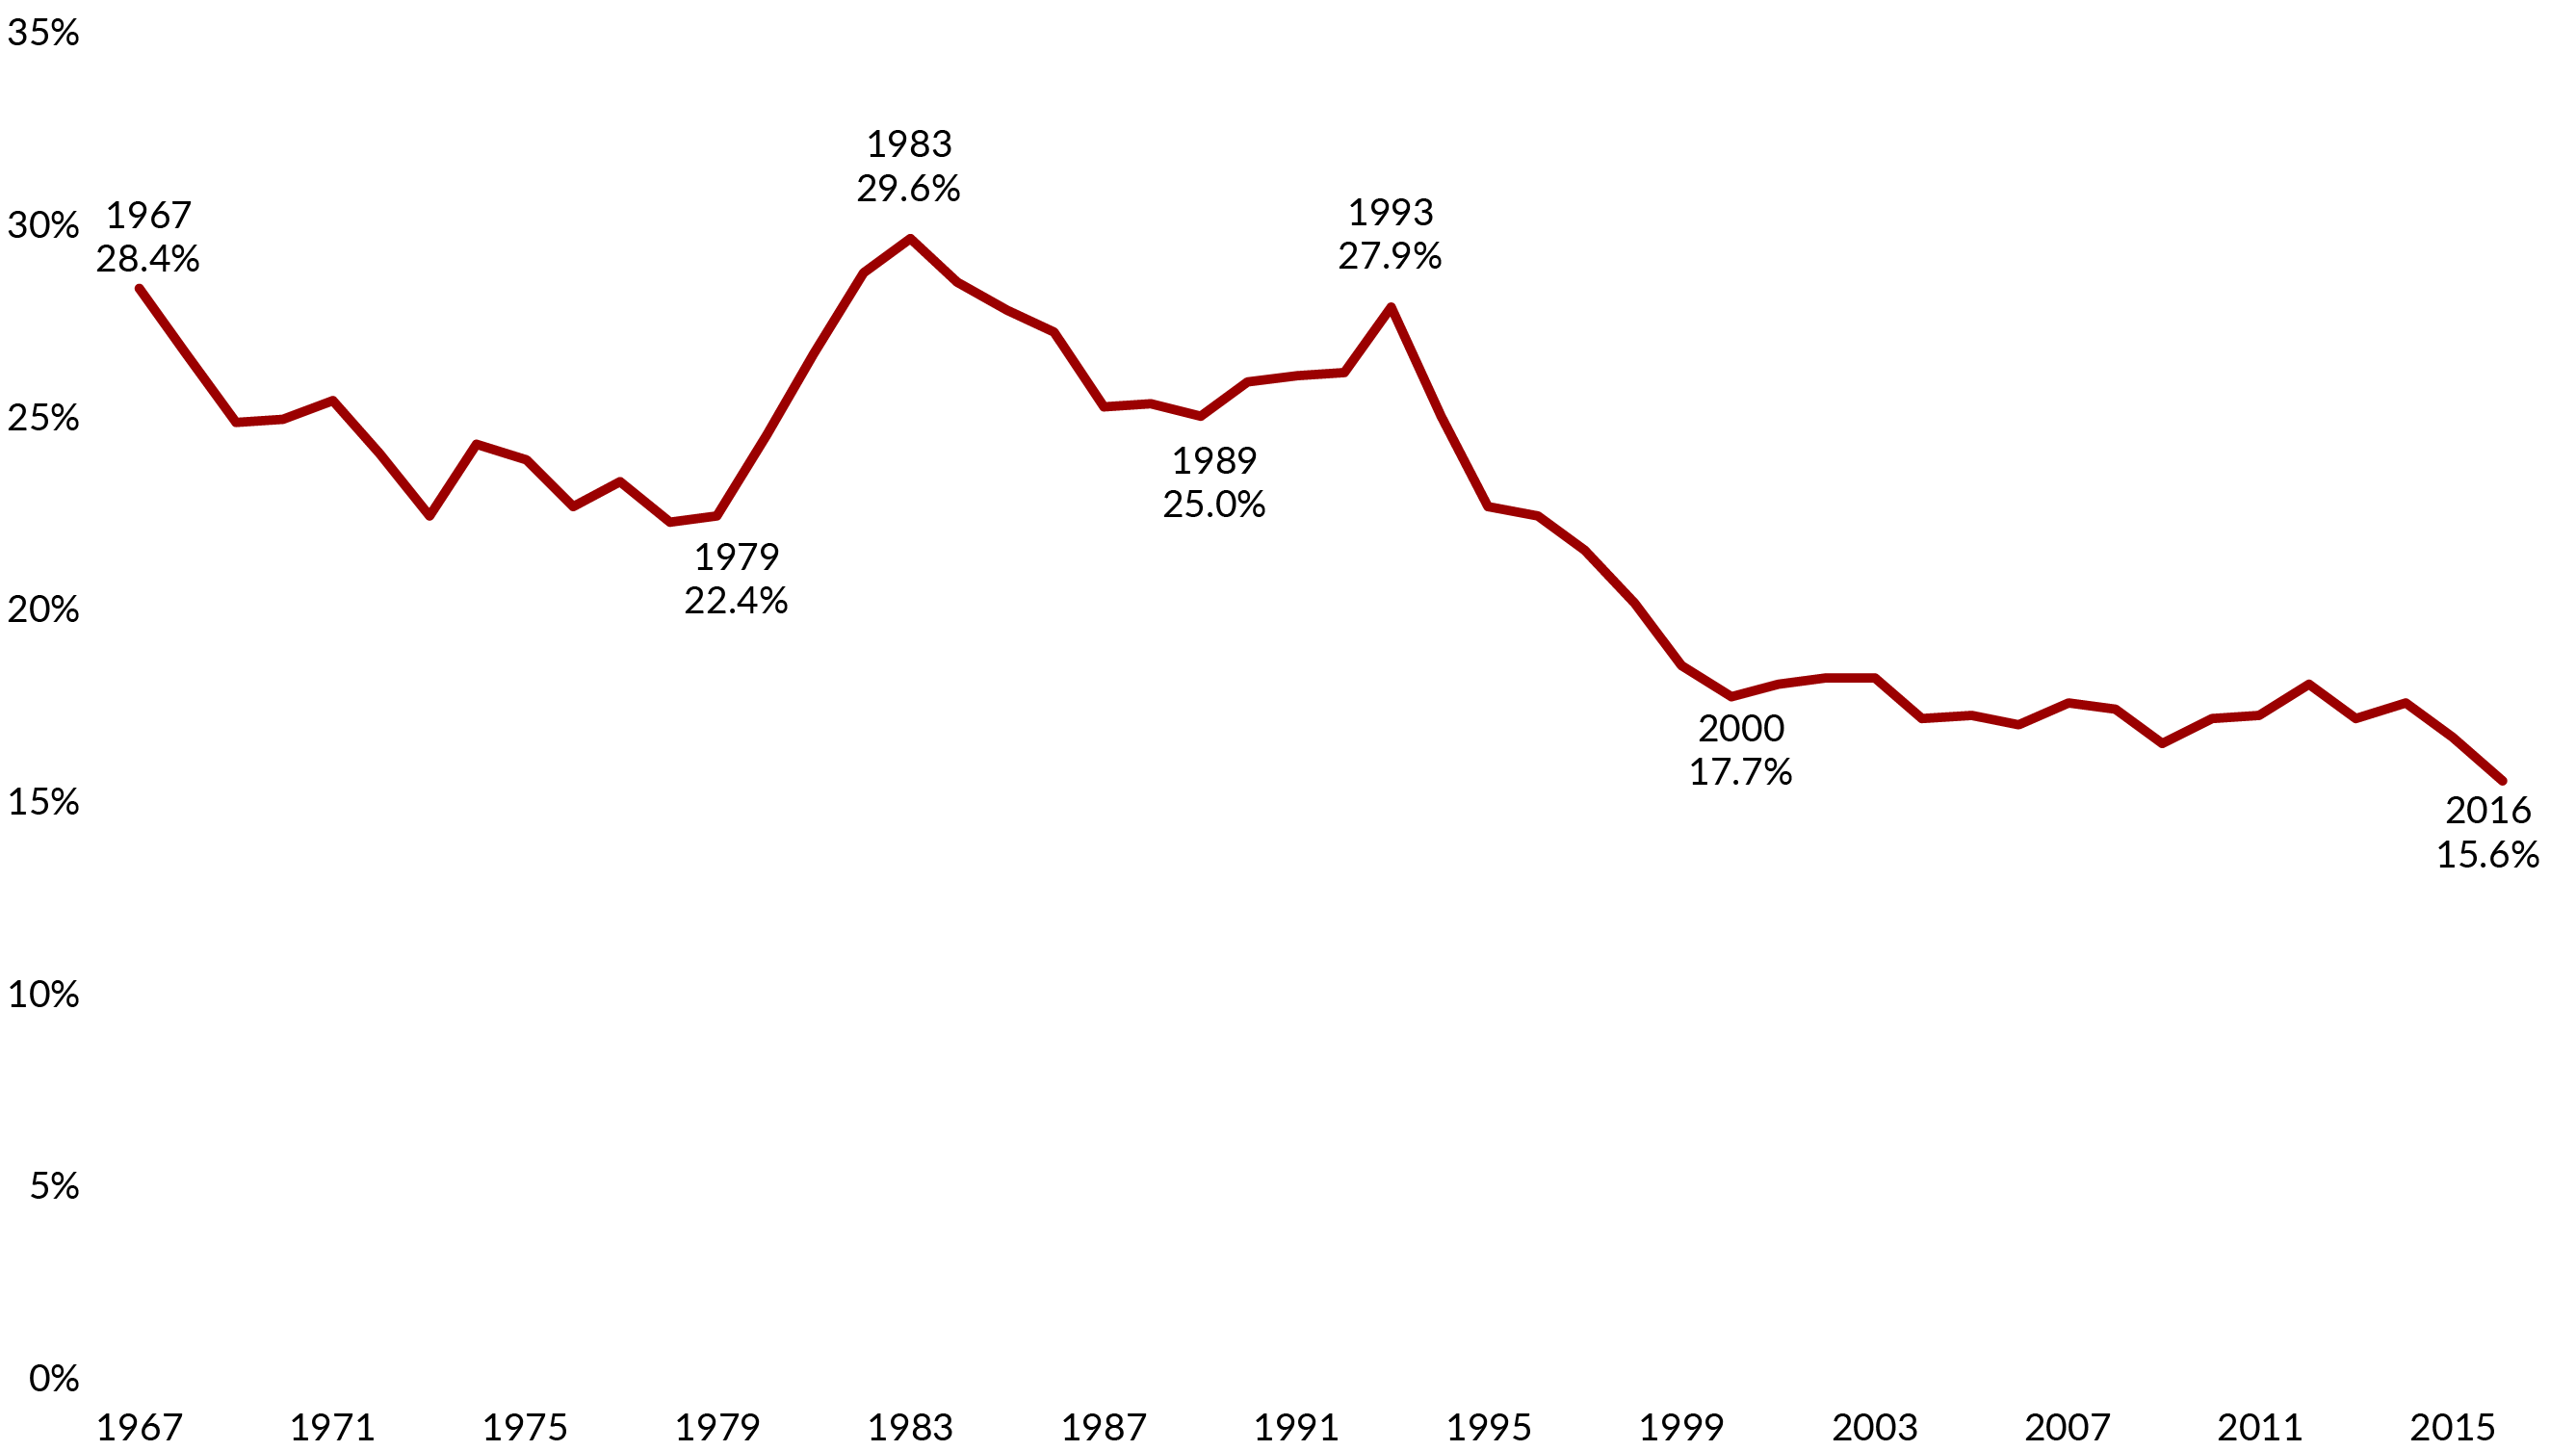
Source: Roadmap to Reducing Child Poverty. Original analyses were commissioned from Christopher Wimer in 2017.
Child poverty harms children, their families, and broader society.
Authors of the Roadmap to Reducing Child Poverty are clear: the weight of research evidence shows that poverty can harm children in a variety of ways, both while they are growing up and throughout their lifetime, over and above location, family type, and other correlates of child poverty.
Poor children tend to develop weaker language, memory, and self-regulation skills than their nonpoor peers. As adults, those who grew up in poverty often have lower earnings and income, higher dependence on public assistance, more health problems, and higher likelihood of committing crimes than those who grew up in more affluent families.
How poverty can harm children’s well-being:
- low birthweight,
- structural changes in brain development,
- adverse childhood experiences,
- increased material hardship,
- child maltreatment,
- worse physical health,
- mental health problems,
- decreased educational attainment, and
- increased risky behaviors, delinquency, and criminal behavior in adolescence and adulthood.
Many studies document especially damaging effects from living in a poor family in early childhood, spending a substantial part of childhood in poverty, and experiencing deep poverty.
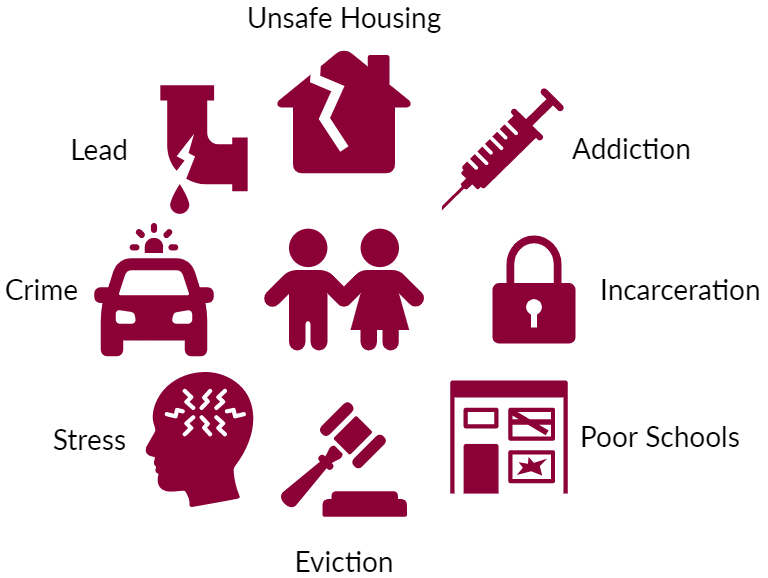
Negative effects can result from low-income parents’ inability to afford financial investments that may support their child’s development and well-being, such as living in a high-income neighborhood with high-quality schools; paying for high-quality childcare; purchasing educational resources to have at home; or providing more parental time by adjusting work hours.
Other negative effects can stem from stress that parents who are poor often experience caused by economic hardship, such as being unable to pay for essentials like food and housing, which has been linked with harsh, inconsistent, and detached parenting, which may harm children’s development.
The negative effects of child poverty (Figure 2) can last a lifetime. As adults, children from poor families typically have lower earnings and income, are more dependent on public assistance, have more health problems, and some are more likely to commit crimes than their more advantaged peers.
Federal antipoverty programs significantly lower child poverty and improve children’s well-being—but they could do more.
If all major federal antipoverty programs were eliminated, the child poverty rate would rise from 13.0% to 30.5% (Figure 3), affecting almost a third of U.S. children. Eliminating all major antipoverty programs would also increase the percentage of children experiencing deep poverty from 2.9% to 16.0%.
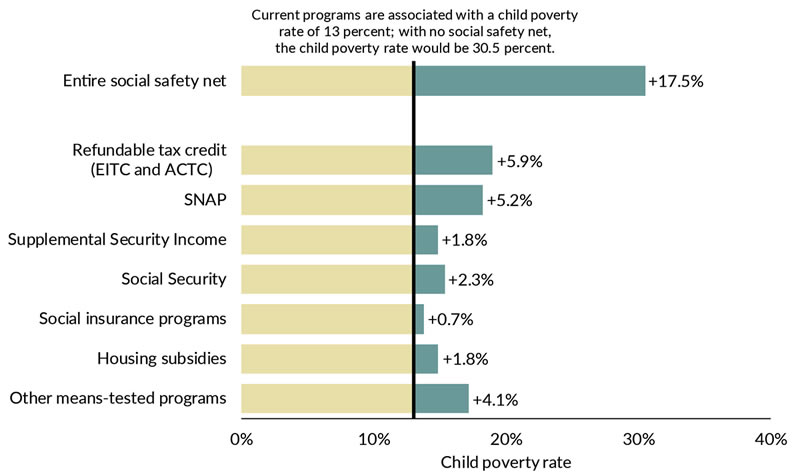
Source: Estimates commissioned by the NASEM consensus committee, using the Supplemental Poverty Measure with the Current Population Survey Annual Social and Economic Supplement, with income adjusted for underreporting.
Among antipoverty programs, the federal Earned Income Tax Credit (EITC) and refundable parts of the Child Tax Credit are most effective, reducing child poverty by almost 6 percentage points. Eliminating the EITC and CTC would put another 4.4 million children in poverty.
The Supplemental Nutrition Assistance Program (SNAP, formerly called Food Stamps) is another antipoverty program that is linked to improved child and adult health outcomes, including improved birth outcomes. Eliminating SNAP would increase the child poverty rate by an additional 5.2 percentage points, from 13.0% to 18.2%. Moreover, SNAP is by far the most effective poverty-fighting federal program for families in deep poverty. Without SNAP, the deep poverty rate would almost double, from 2.9% to 5.7%.
The Social Security program is also a very important benefit for the deep poor, without which deep poverty would rise from 2.9% to 4.4%.
Although current public antipoverty programs greatly reduce child poverty, with 9.6 million children still living in poverty, including 2.1 million in deep poverty, the National Academies report authors call on the nation to do more.
Child poverty costs society between $800 billion and $1.1 trillion annually—many times the cost of reducing it.
Child poverty has negative effects on the economy as well as on children and families. Estimates suggest that child poverty costs the U.S. between $800 billion and $1.1 trillion annually. This amounts to more than the combined worth of 4 or 5 of the world’s most valuable companies (Amazon, Apple, Google, Microsoft, and Visa). Costs accumulate from:
- lost adult productivity,
- increased crime costs, and
- increased health expenditures associated with children growing up in poor families.[3]
A range of studies have estimated the total cost of child poverty to society. The common thread between them is uncertainty over the exact amount. However, report authors note:
Policy/Practice
Researchers created detailed, real-world directions for reducing child poverty.
A Roadmap to Reducing Child Poverty may be a policymaker’s dream come true: the report provides four detailed, doable plans to reduce child poverty through changes to policies and programs. Two of the packages would cut child poverty in half (Figure 4 and explored further below), and two would significantly reduce child poverty. All packages include plans to boost employment and income as important antipoverty levers.
Roadmap recommendations are evidence-based and draw from a large body of social policy research. All packages involve combinations of program enhancements, including those that encourage and reward gainful employment and those that provide basic income support to help cover the expenses of raising children. The two packages with the greatest impact—halving child poverty within 10 years—are outlined below.
While both packages are expensive, their price tag is far less than the current costs of child poverty to the U.S. economy.
Policy Package #1: Means-tested supports and work
Expands four existing programs
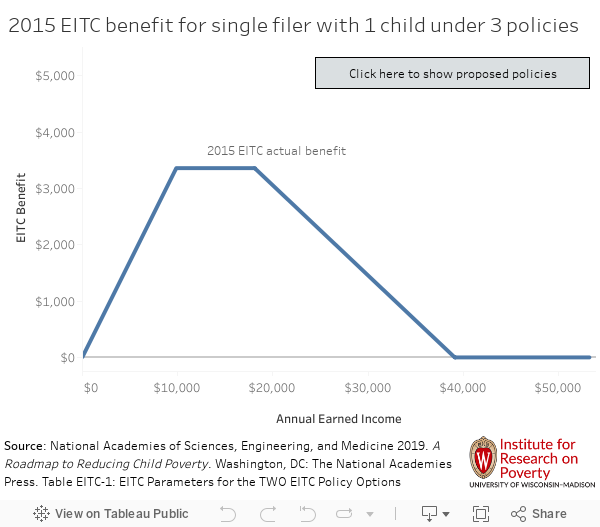
- Increase payments under the EITC along the phase-in and flat portions of the EITC schedule (see interactive below).
- Convert the Child & Dependent Care Tax Credit (CDCTC) to a fully refundable tax credit so that its benefits reach families with the lowest incomes and who have children under age 5.
- Increase SNAP benefits by 35% and increase benefits for older children and for summer programs.
- Increase the number of housing vouchers directed to families with children so that 70% of eligible families that are not currently receiving subsidized housing would use them.
Estimated cost of package: $90.7 billion per year
Net change in earnings: $2.2 billion per year
Net change in jobs: +404,243 per year
Policy Package #2: Universal supports and work
Combines work incentives, economic security, and social inclusion
- Increase EITC payments by 40% across the entire tax schedule, keeping the current range of the phase-out region (see interactive below).
- Convert the CDCTC to a fully refundable tax credit and concentrate its benefits on families with the lowest incomes and with children under age 5.
- Raise the current federal minimum wage from $7.25 to $10.25 and index it to inflation after it is implemented.
- Restore eligibility for SNAP, Temporary Assistance for Needy Families (TANF), Medicaid, Supplemental Security Income (SSI) and other means-tested federal programs for legal immigrants.
- Create a new child allowance that pays a monthly benefit of $225 per month ($2,700 per year) to families of all children under age 17. This child allowance would also be paid to legal immigrants.
- Institute a child support assurance policy to provide a backup source of income if a noncustodial parent does not pay child support and assuring guaranteed minimum child support of $100 per month per child.
Estimated cost of package: $108.8 billion per year
Net change in earnings: $13.4 billion per year
Net change in jobs: +611,182 per year
| Means-tested supports & work package | Universal supports & work package | ||
| Work-oriented programs and policies |
Expand EITC | ||
| Expand Child Tax Credit | |||
| Increase minimum wage | |||
| Income support-oriented programs and policies |
Expand housing voucher program | ||
| Expand SNAP benefits | |||
| Begin child allowance | |||
| Begin child support assurance | |||
| Eliminate 1996 immigration restrictions | |||
| Economic impact | Estimated cost (billions of dollars) | $90.7 | $108.8 |
| Net change in earnings (billions of dollars) | $2.2 | $13.5 | |
| Net change in jobs | +404,243 | +611,182 |
Notes
[1] This brief draws from a consensus committee report by the National Academies of Sciences, Engineering, and Medicine (NASEM), A Roadmap to Reducing Child Poverty, Washington, D.C.: The National Academies Press, 2019. doi: https://doi.org/10.17226/25246. The report was edited by Greg Duncan and Suzanne Le Menestrel. Consensus committee members are noted in the text of this brief. The estimates are based on an adjusted Supplemental Poverty Measure that counts social program benefits as resources and accounts for underreporting of income—and so gives a clearer picture of the impacts of federal assistance than the official poverty measure, which doesn’t take these important factors into account.
[2] A Roadmap to Reducing Child Poverty authors delineate the adjusted supplemental poverty measure they used in Appendix D, 2-2, p. 293, available at https://www.nap.edu/read/25246/chapter/15#293.
[3] To learn more about child poverty’s costs, see NASEM, A Roadmap to Reducing Child Poverty, Chapter 3, “Macroeconomic Costs of Child Poverty to Society,” p. 89, available at https://www.nap.edu/read/25246/chapter/5#89.
[4] NASEM, A Roadmap to Reducing Child Poverty, p. 91, available at https://www.nap.edu/read/25246/chapter/5#90.
Categories
Child Development & Well-Being, Child Poverty, Children, Economic Support, Employment, Family & Partnering, Family Structure, Food & Nutrition, Food Assistance, Health, Housing, Housing General, Immigration, Inequality & Mobility, Justice System, Justice System General, Low-Wage Work, Means-Tested Programs, Neighborhood Effects, Place, Poverty Measurement, Poverty Measurement General, Racial/Ethnic Inequality, Social Determinants of Health, Social Insurance Programs, Unemployment/Nonemployment
Tags
Child Tax Credit (CTC), Cross-State Comparison, Earned Income Tax Credit (EITC), Medicaid, Negative Income Tax, Race/Ethnicity, Rural, Single Parent, SNAP/Food Stamps, SSI/SSDI, TANF/AFDC/W-2, Urban, Welfare