The U.S. Census Bureau report Poverty in the United States: 2024, released in September 2025, presented estimates for the year 2024 using two measures, the Official Poverty Measure (OPM) and the Supplemental Poverty Measure (SPM). The OPM is the original measure used by the federal government to track poverty; it is also used as the basis for determining eligibility for many anti-poverty programs. The OPM is based on a formula developed in the 1960s that has been updated for inflation since that time. The SPM is a more robust set of measures taking into account relevant data on the needs and expenses of U.S. American households. The SPM accounts for geographic differences in the cost of living, measures the impact of many major anti-poverty programs, and has a broader definition of household membership than the OPM. The Census Bureau introduced the SPM in 2010, so rates shown from 1967 to 2010 are historical SPM estimates developed by researchers at Columbia University.
For more on the differences between poverty measures, see our FAQ: How Is Poverty Measured?
The poverty rate in 2024 was 10.6% (35.9 million people) under the OPM and 12.9% (43.7 million people) under the SPM. The graph below shows the U.S. poverty rate for the Official Poverty Measure (1959 to 2024) and the Supplemental Poverty Measure (1967 to 2024).
- Who experiences poverty?
- Who in Wisconsin experiences poverty?
- How is poverty measured?
- What are poverty thresholds and poverty guidelines?
- What is the consumer price index and how is it used?
- What are good sources of information on basic trends in poverty and related issues?
- What are good sources of demographic and socioeconomic information for states, counties, and cities?

The official U.S. poverty rate when it was first measured in 1959 was 22.4%. After a major decline throughout the 1960s, the overall poverty rate has hovered between about 10% and 15%. During that period, the SPM or historical SPM has generally been a few points higher than the OPM (because the SPM has higher and more accurate poverty thresholds). This pattern was reversed in 2020 and 2021 because the SPM rate reflected the poverty-reducing effect of public benefits offered in response to the COVID-19 pandemic. The pattern reversed again in 2022 and has maintained its historical norm of the SPM (12.9%) being a few points higher than the OPM (11.1%).
Poverty Rates by Demographic Subgroups
The U.S. Census Bureau releases annual estimates of poverty by various subgroups in the United States. The sections below describe each of these groups for the year 2024:
SPM: The SPM rate for U.S. Americans under age 18 hit an historic low of 5.2% in 2021 but rose to 13.4% by 2024. The SPM poverty rate for adults ages 18 to 64 was 12.2% in 2024, while for those 65 years and older the rate was 15% in 2024. Note that the SPM accounts for higher average healthcare costs for older adults while the OPM does not. This is, in part, why SPM poverty rates for older adults are higher than OPM rates.
OPM: The OPM poverty rate for those under age 18 was 14.3% in 2024. For adults aged 18 to 64, the OPM rate was 9.6%, and 9.9% for adults over 65 years of age.
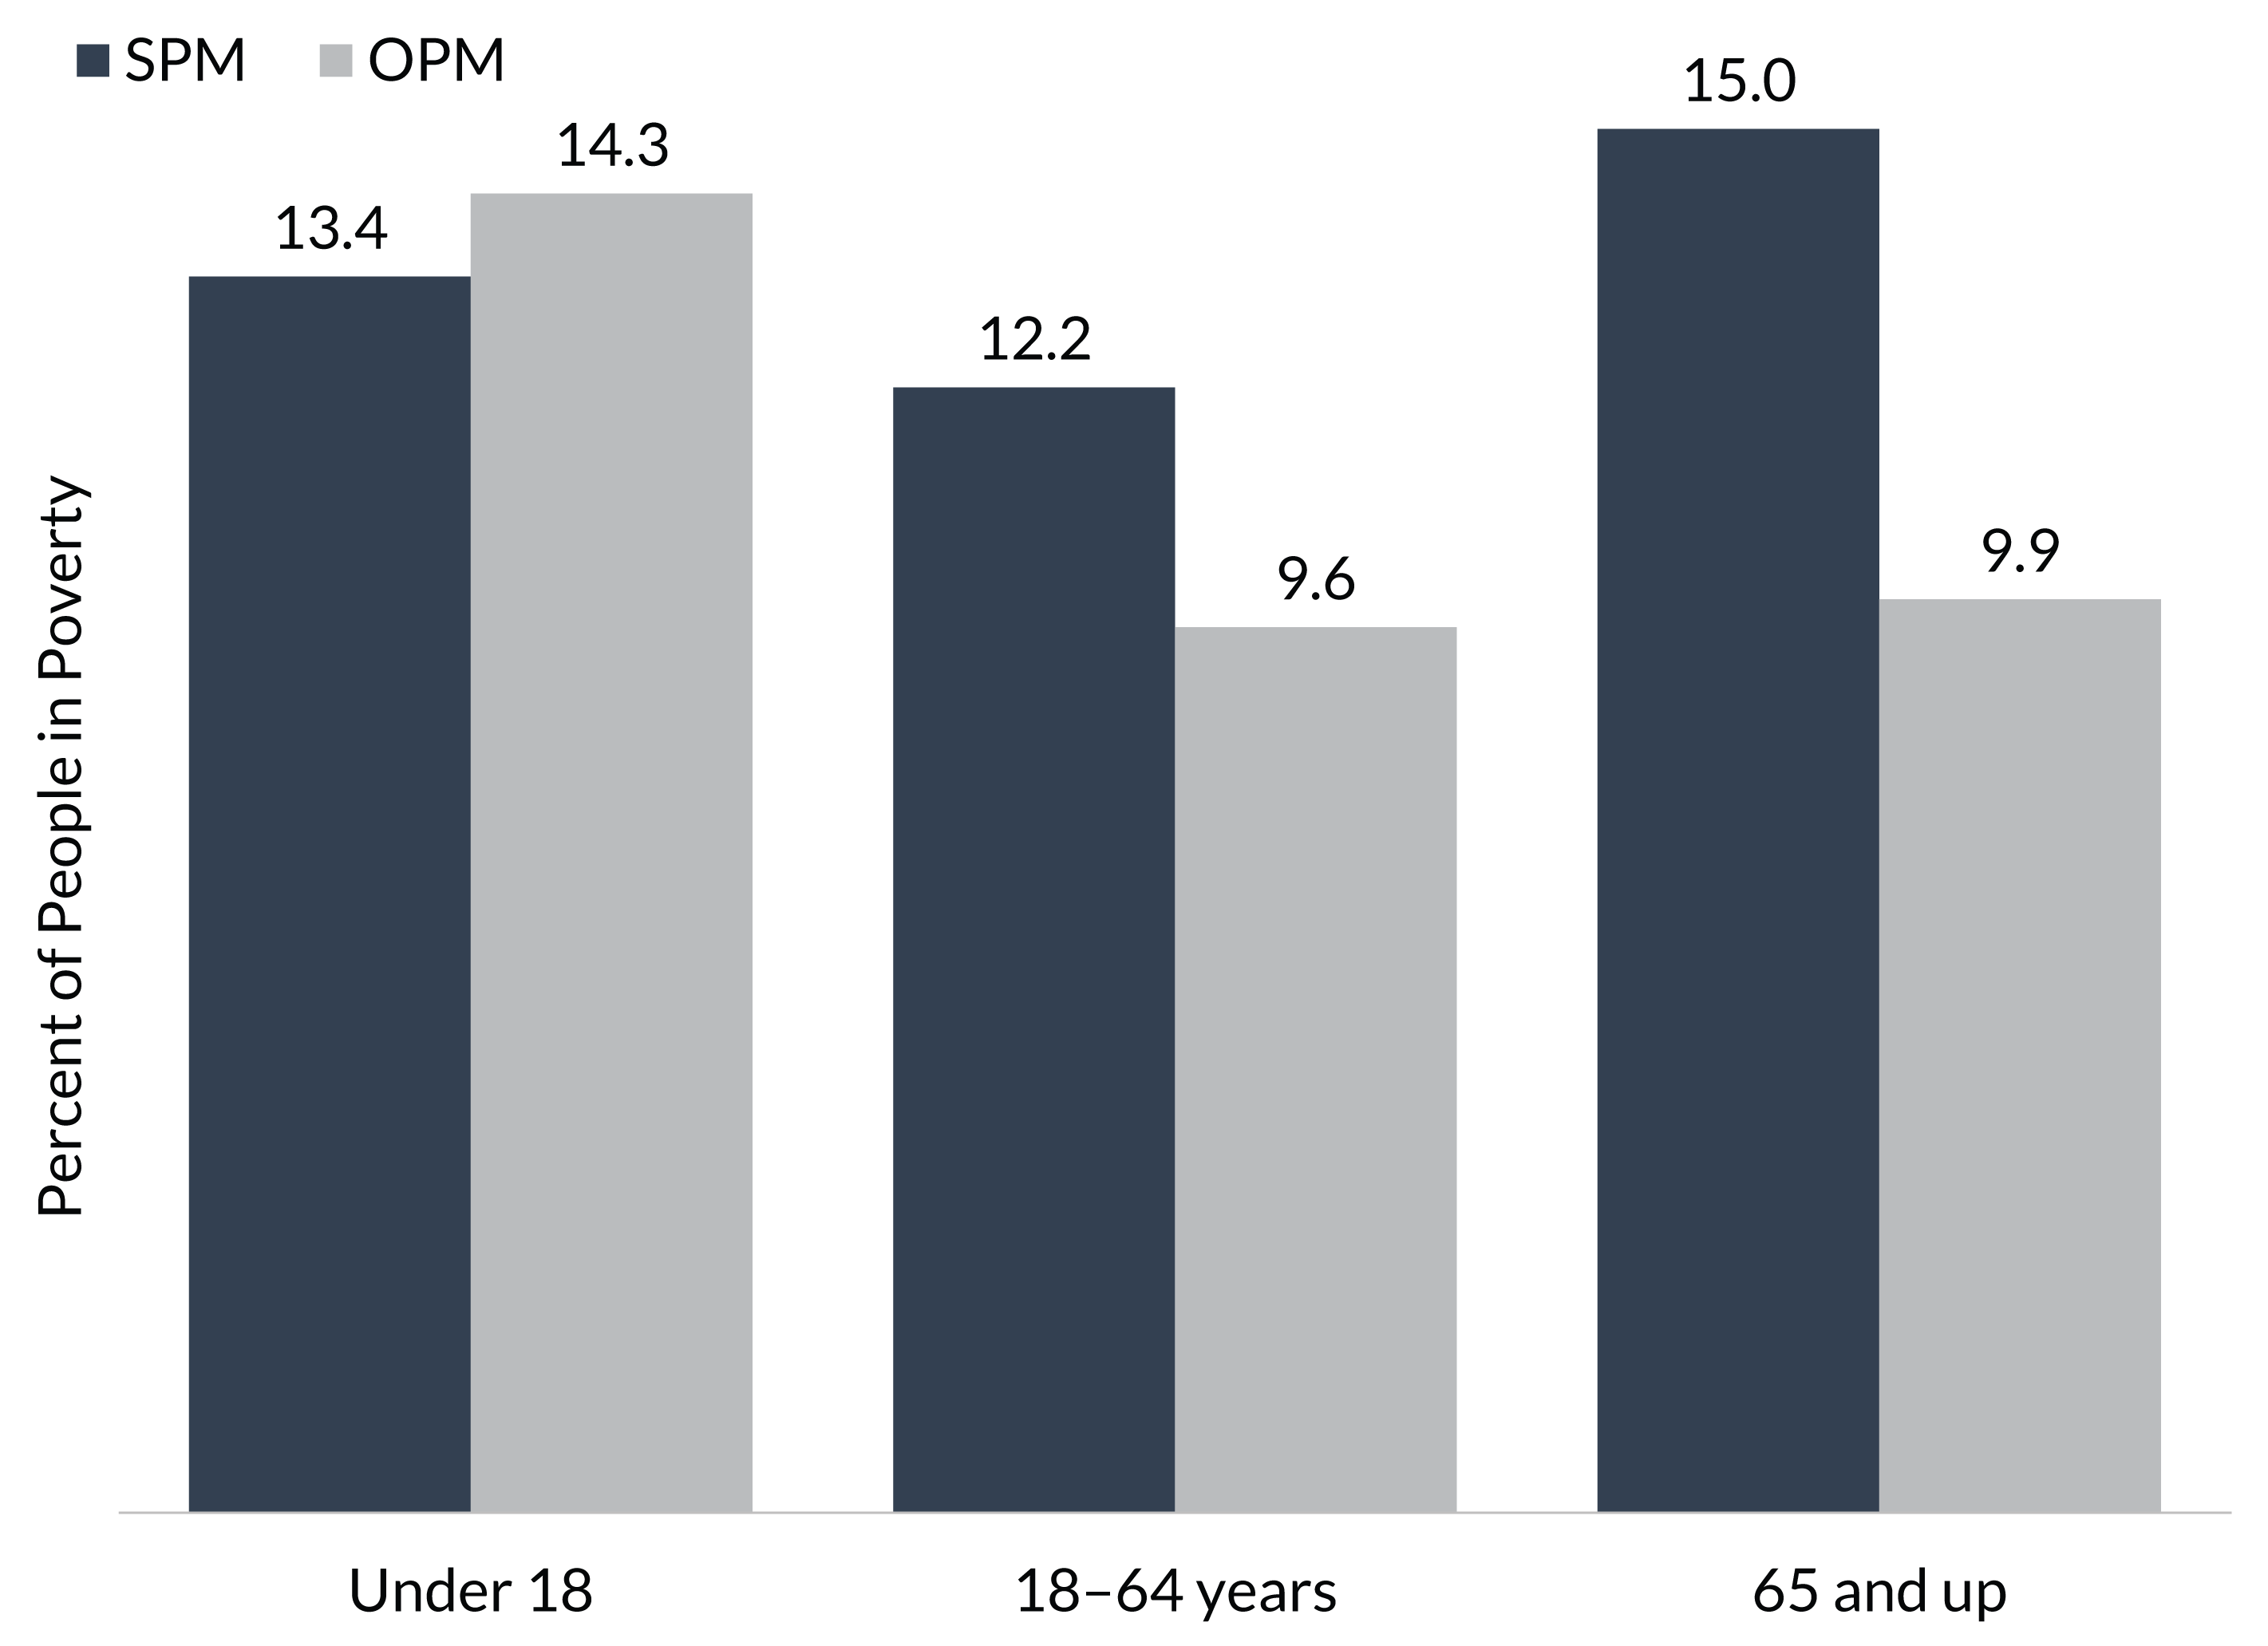
Source: U.S. Census Bureau. Poverty in the United States: 2024. (September 2025): Figure 8, p. 7. https://www.census.gov/library/publications/2025/demo/p60-287.html
SPM: Black/African Americans in 2024, including all age groups, had the highest poverty rate under the SPM at 20.7%. Other SPM rates grouped by race and ethnicity in 2024 included Hispanic Americans of any race (20.3%), American Indian and Alaska Native peoples (19.8%), those identifying as two or more races (13.5%), Asian Americans (12.1%), and whites (11.5%).
OPM: Across all age groups, American Indian and Alaskan Native peoples had the highest poverty rate under the OPM in 2024 at 19.2%, followed by Black / African Americans (18.4%), Hispanics of any race (15%), those identifying as two or more races (13.4%), whites (9.3%), and Asian Americans (7.4%).
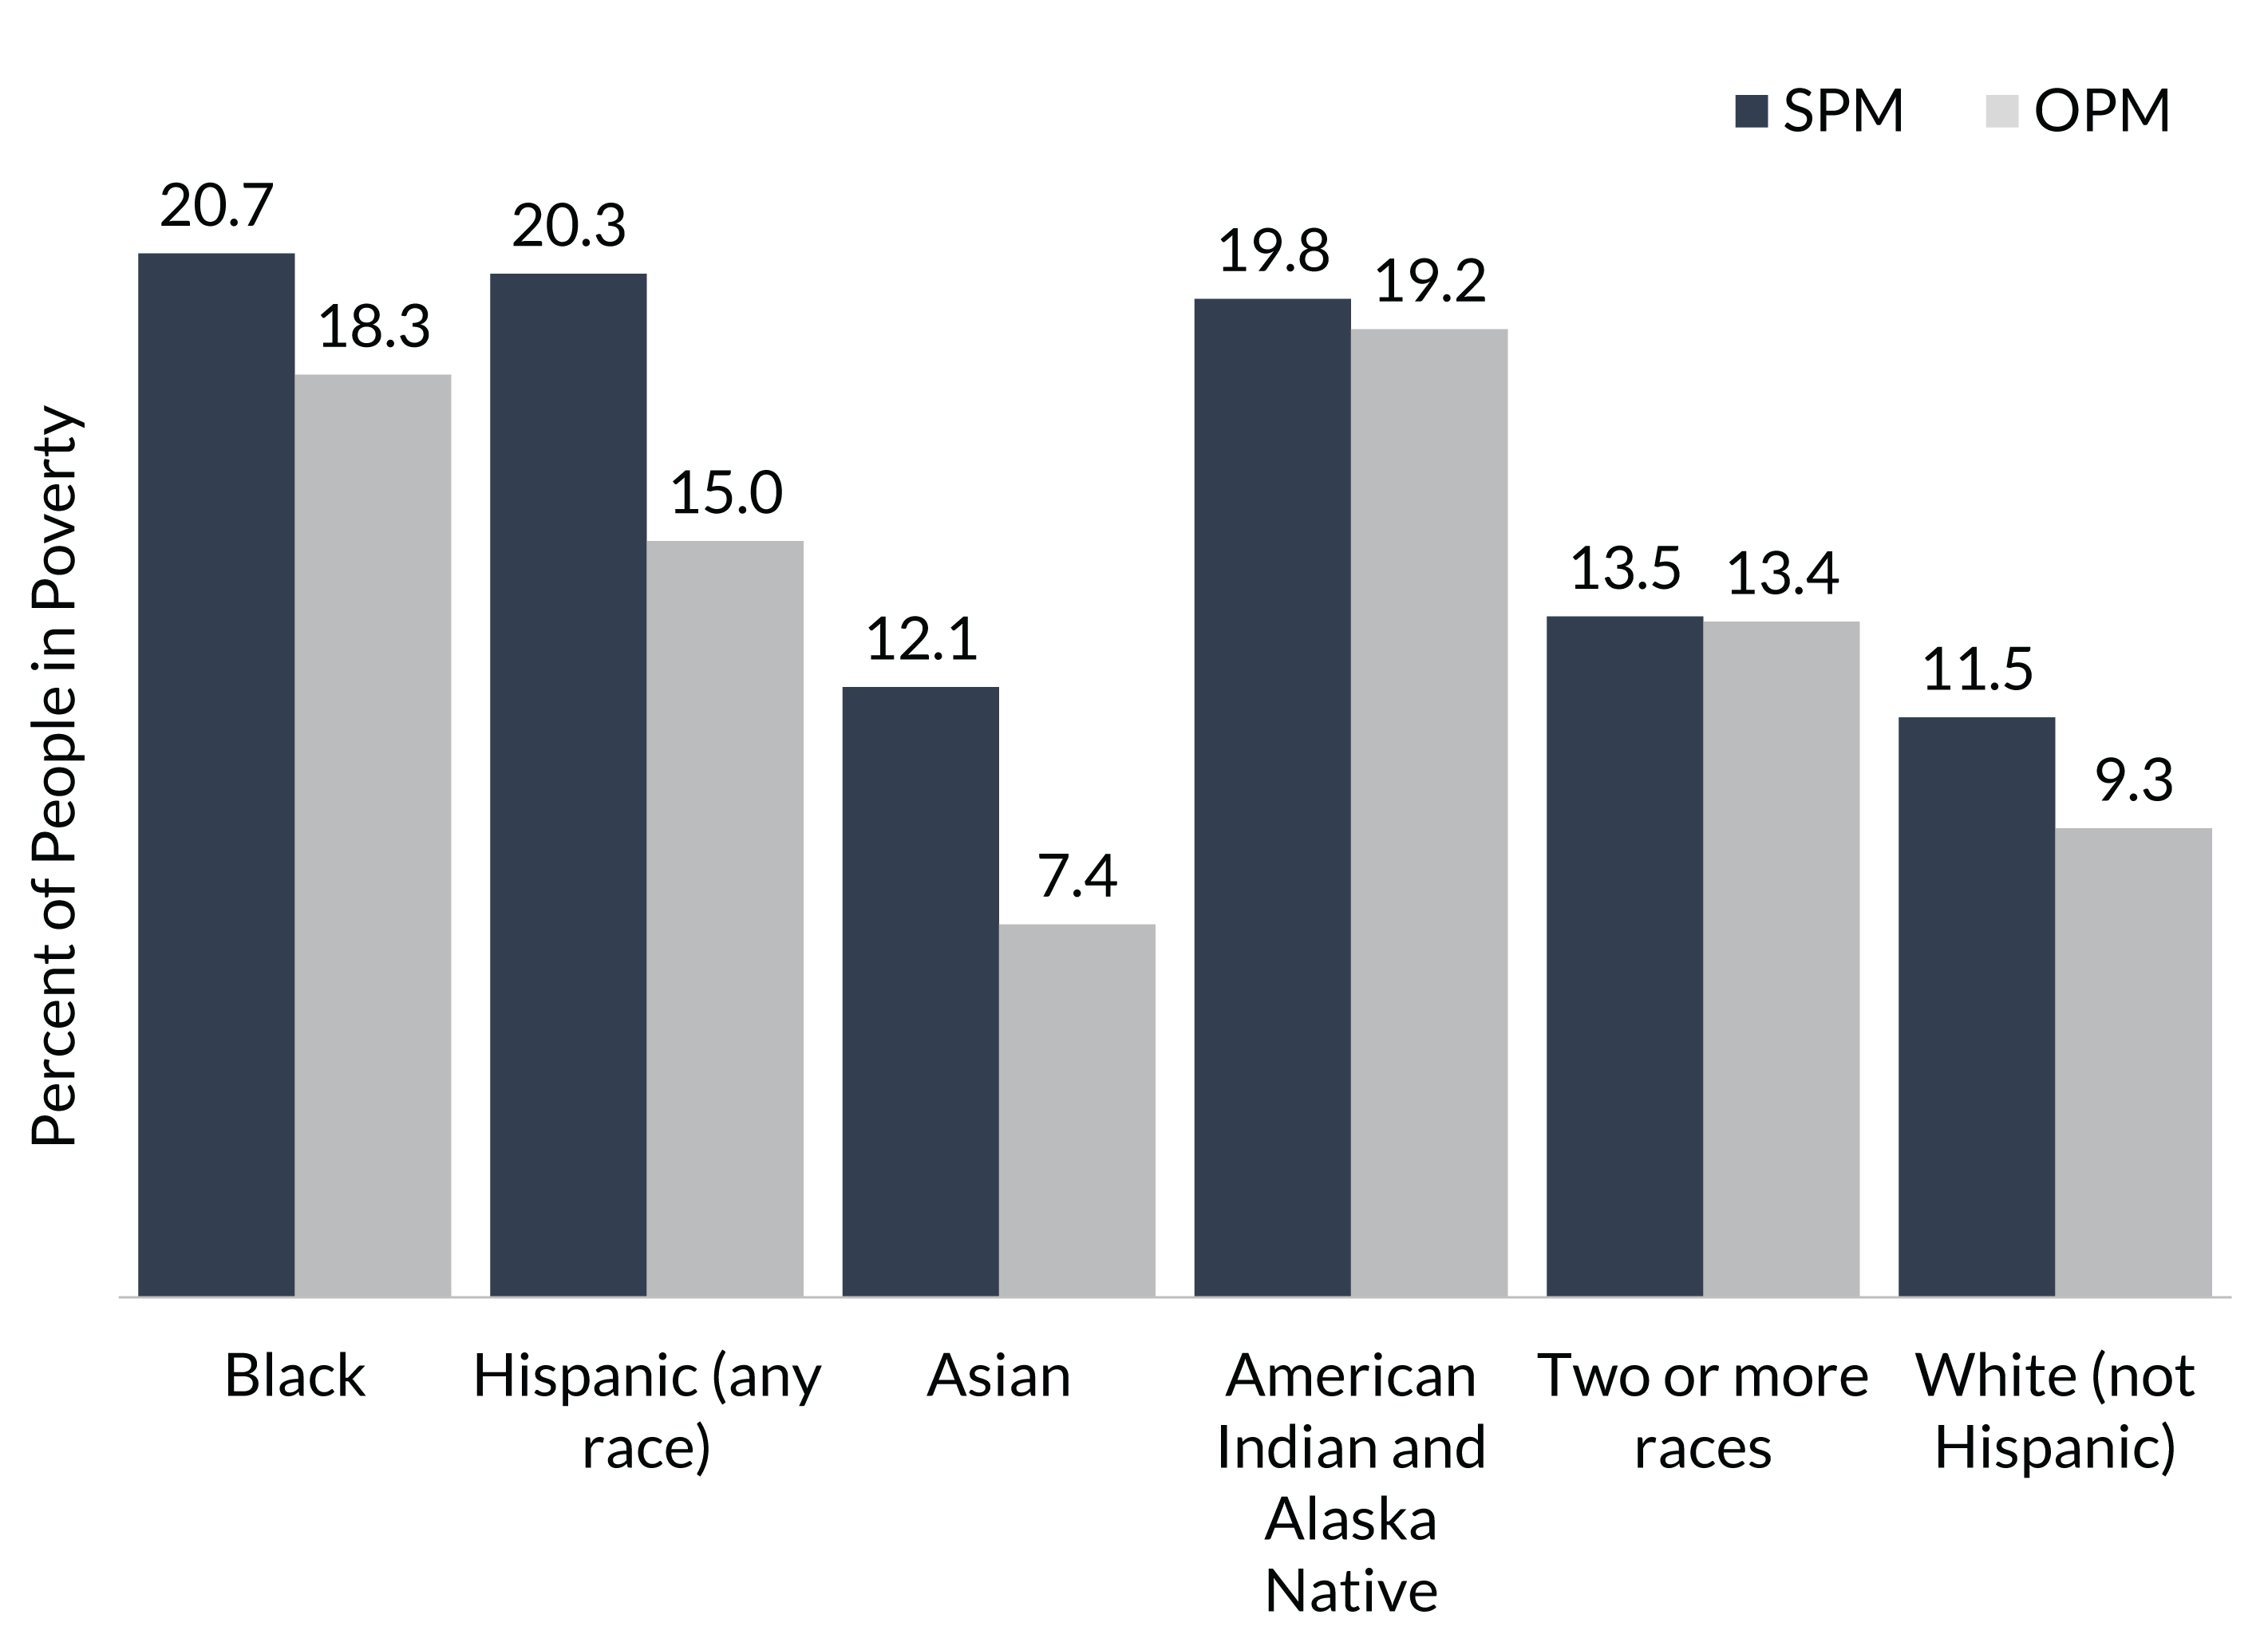
Source: U.S. Census Bureau. Poverty in the United States: 2024. (September 2025): Table B-4, pp 46-47. https://www.census.gov/library/publications/2025/demo/p60-287.html
Differences between the SPM and OPM rates by household unit occur, in part, because the OPM only counts people related by birth, marriage, or adoption as being part of the same resource-sharing unit. The SPM takes a more expansive approach to “household” and includes families, unmarried cohabiting partners and relatives, foster children under the age of 22, and unrelated children under age 15.
SPM: Married couple and cohabiting partner households had the lowest poverty rates in 2024 at 7.7% and 13.0%, respectively. For female reference person or head of household, the poverty was at 24.6%, male reference person at 16.2%, and 22.6% for unrelated individuals living in the same household.
OPM: Married-couple poverty was lowest among household unit types under the OPM at 4.6%. Because the OPM does not count cohabiting partners as part of the same resource sharing unit, their poverty rate under the OPM was much higher, at 22.0%, versus 13.0% under the SPM. Female reference person poverty was at 21.6%, male reference person poverty was at 9.9%, and 18.5% for unrelated individuals living in the same household.
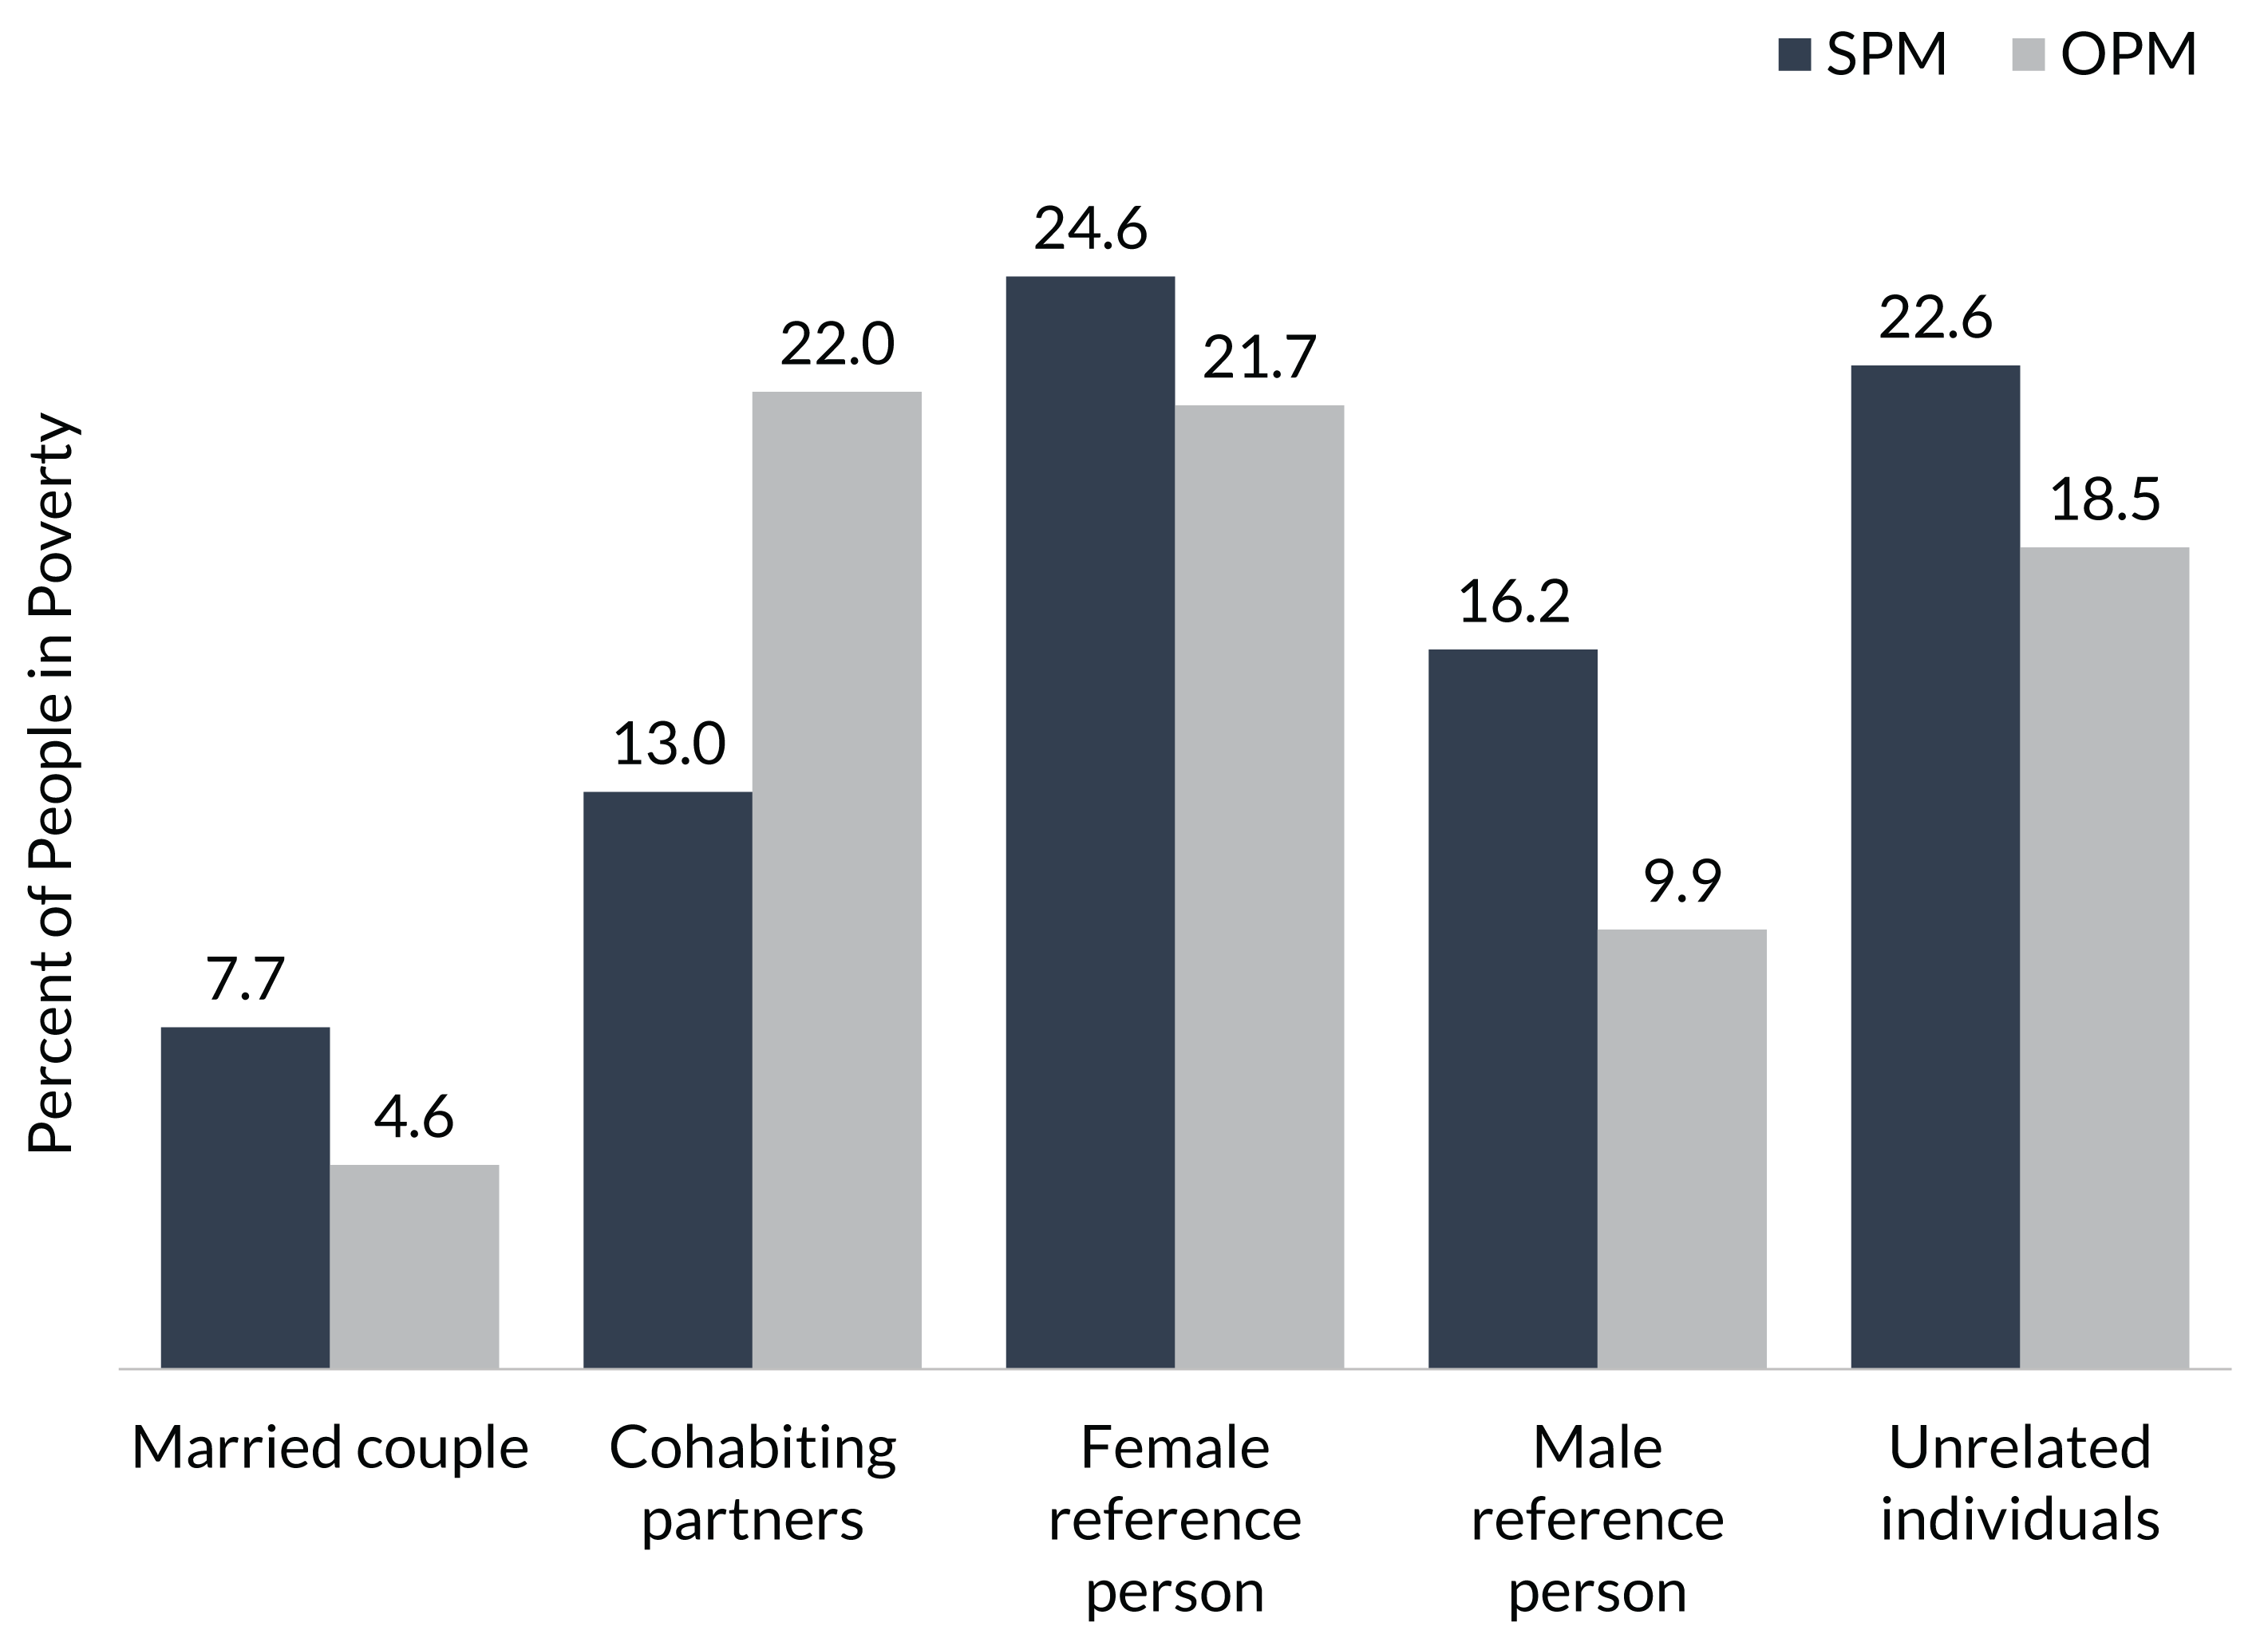
Source: U.S. Census Bureau. Poverty in the United States: 2024. (September 2025): Figure 7, pg. 10. https://www.census.gov/library/publications/2025/demo/p60-287.html
Poverty rates by work experience followed similar patterns under the SPM and OPM in 2024. People who did not work at least one week had the highest rates of poverty at 30.8% (SPM) and 28.2% (OPM). Individuals who worked less than full-time, year-round experience poverty rates of 14.9% (SPM) and 11.4% (OPM). Those who worked full-time, year-round had the lowest poverty rates at 4.1% (SPM) and 1.8% (OPM), while average poverty rates for all workers were 7.0% under the SPM and 4.4% under the OPM.
Since “work experience” is measuring an individual characteristic rather than a household-level characteristic, the statistics here show people with these types of work experiences who are living in households with these poverty rates. This helps explain, for example, how most people who are not working are living in households not experiencing poverty; others in the household may well be working.
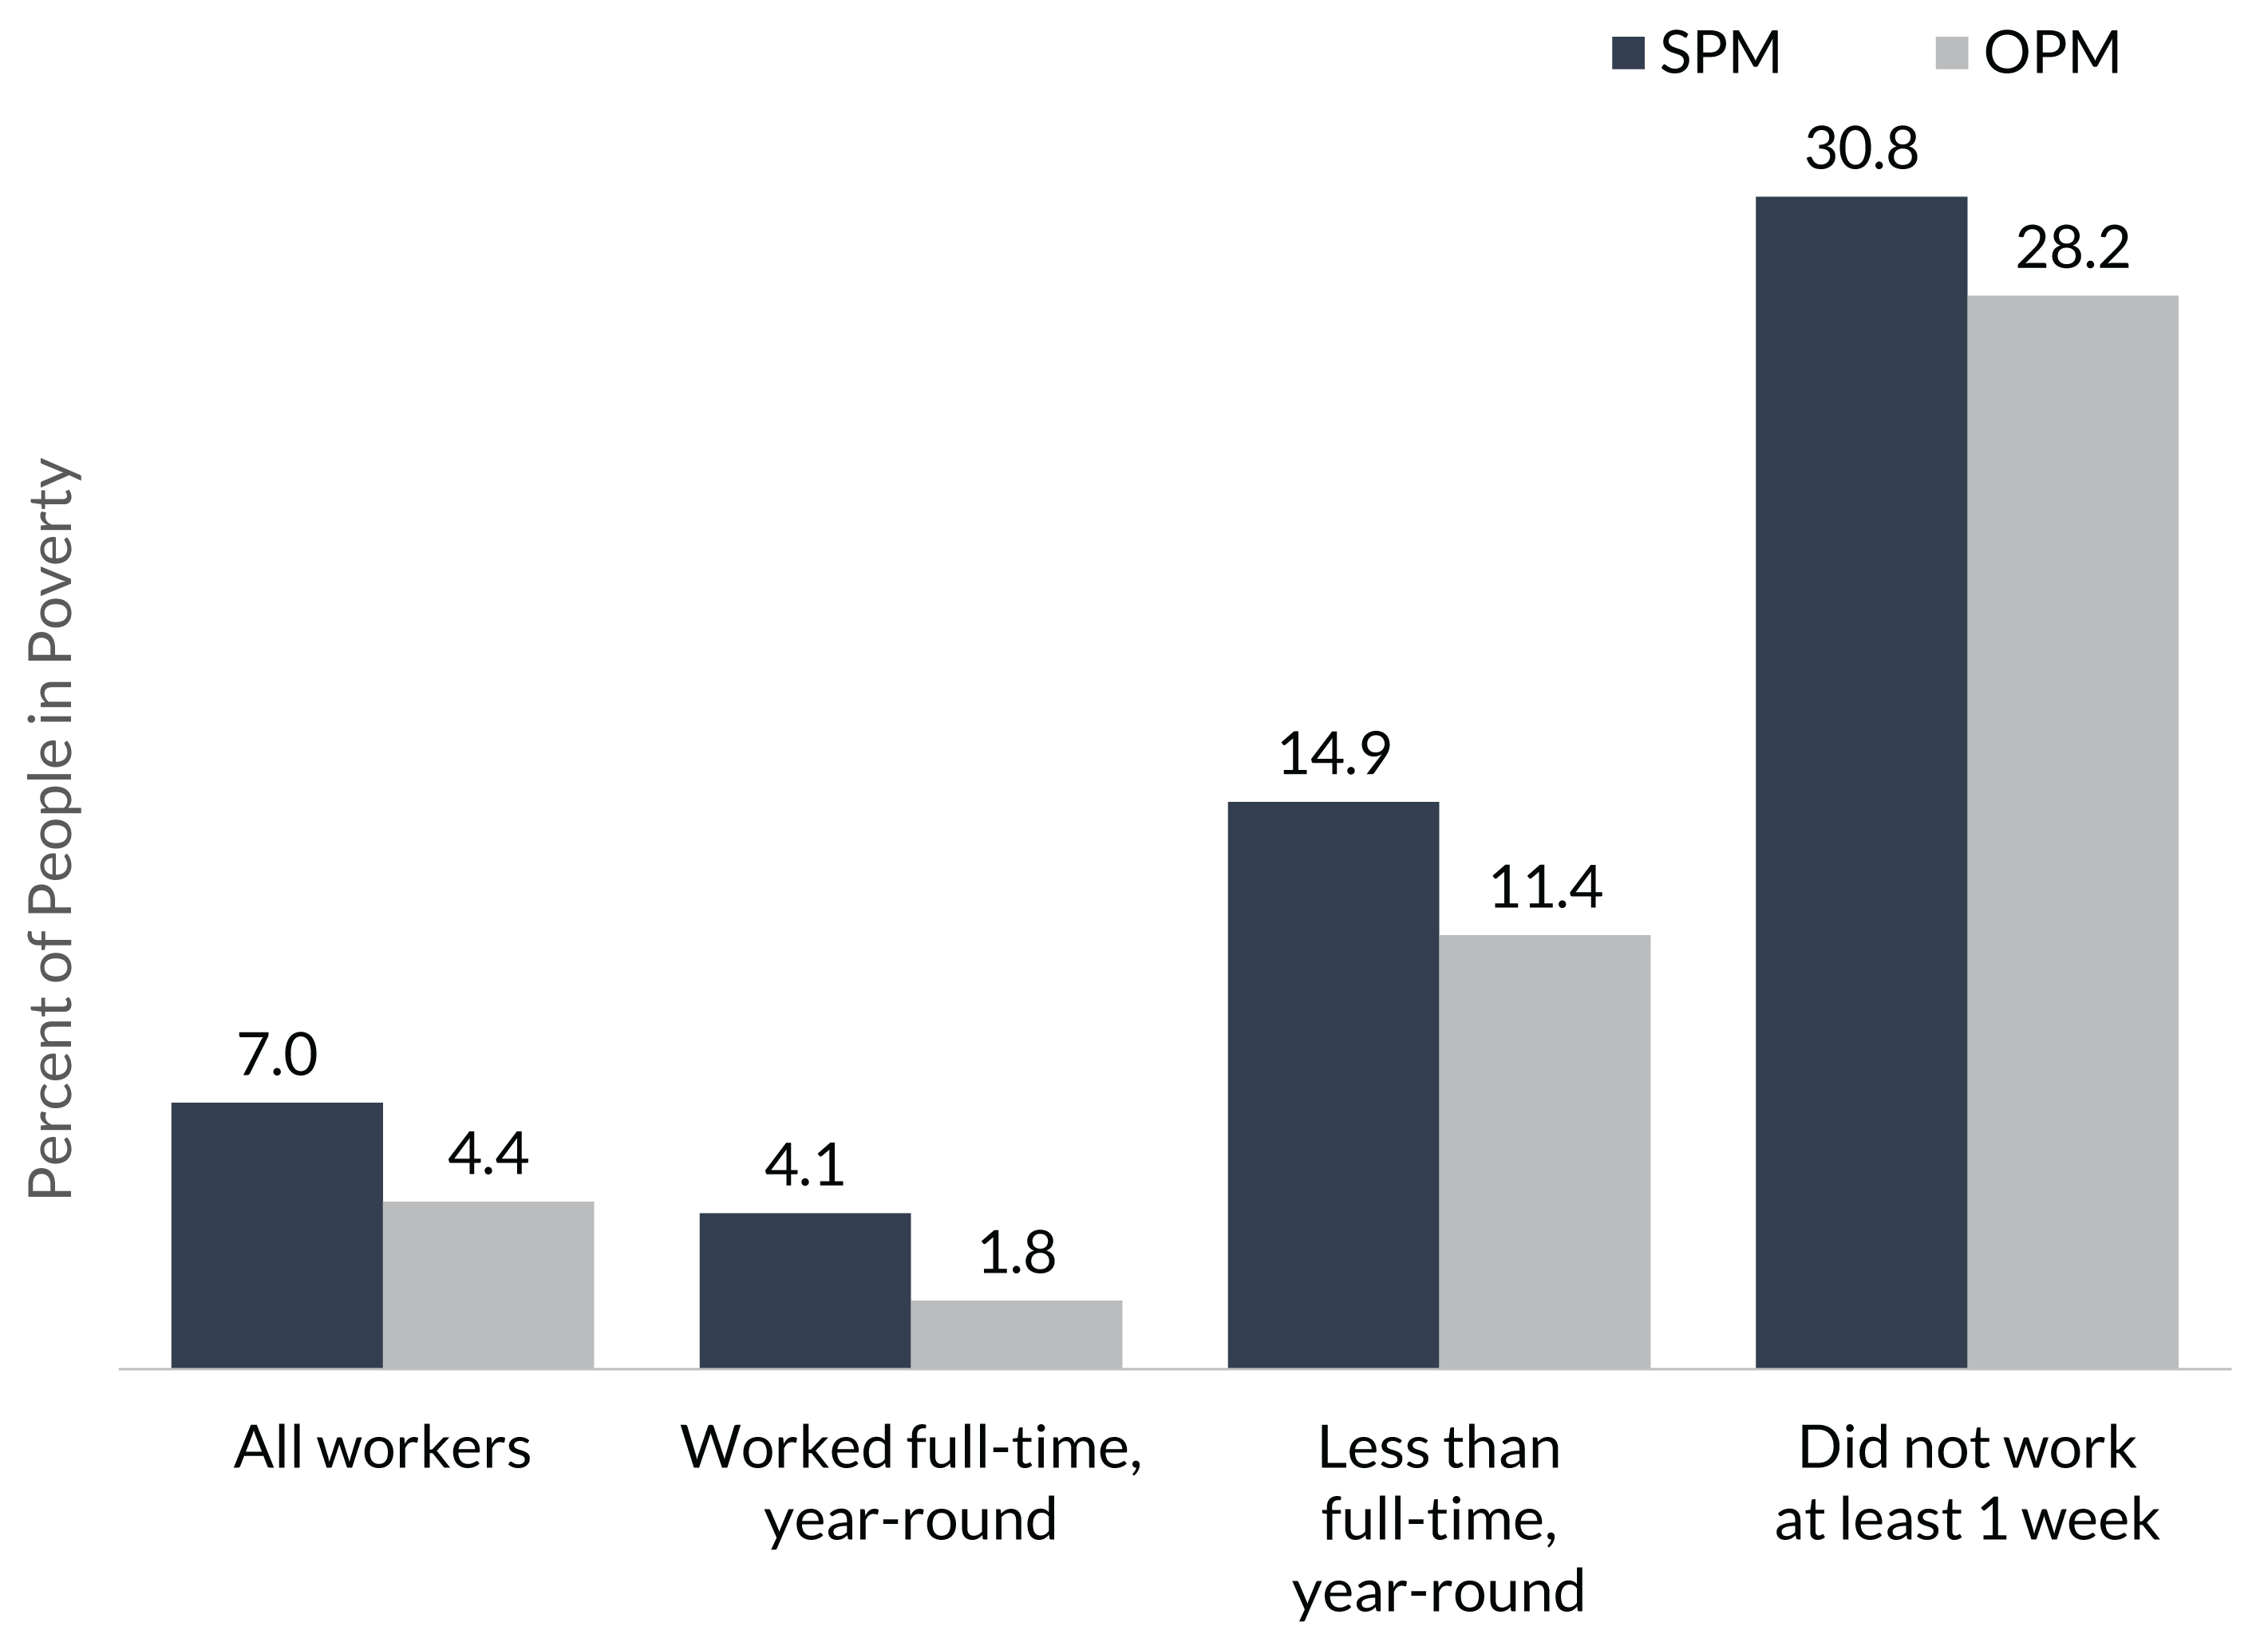
Source: U.S. Census Bureau. Poverty in the United States: 2024. (September 2025), Figure 7, p. 10. https://www.census.gov/library/publications/2025/demo/p60-287.html
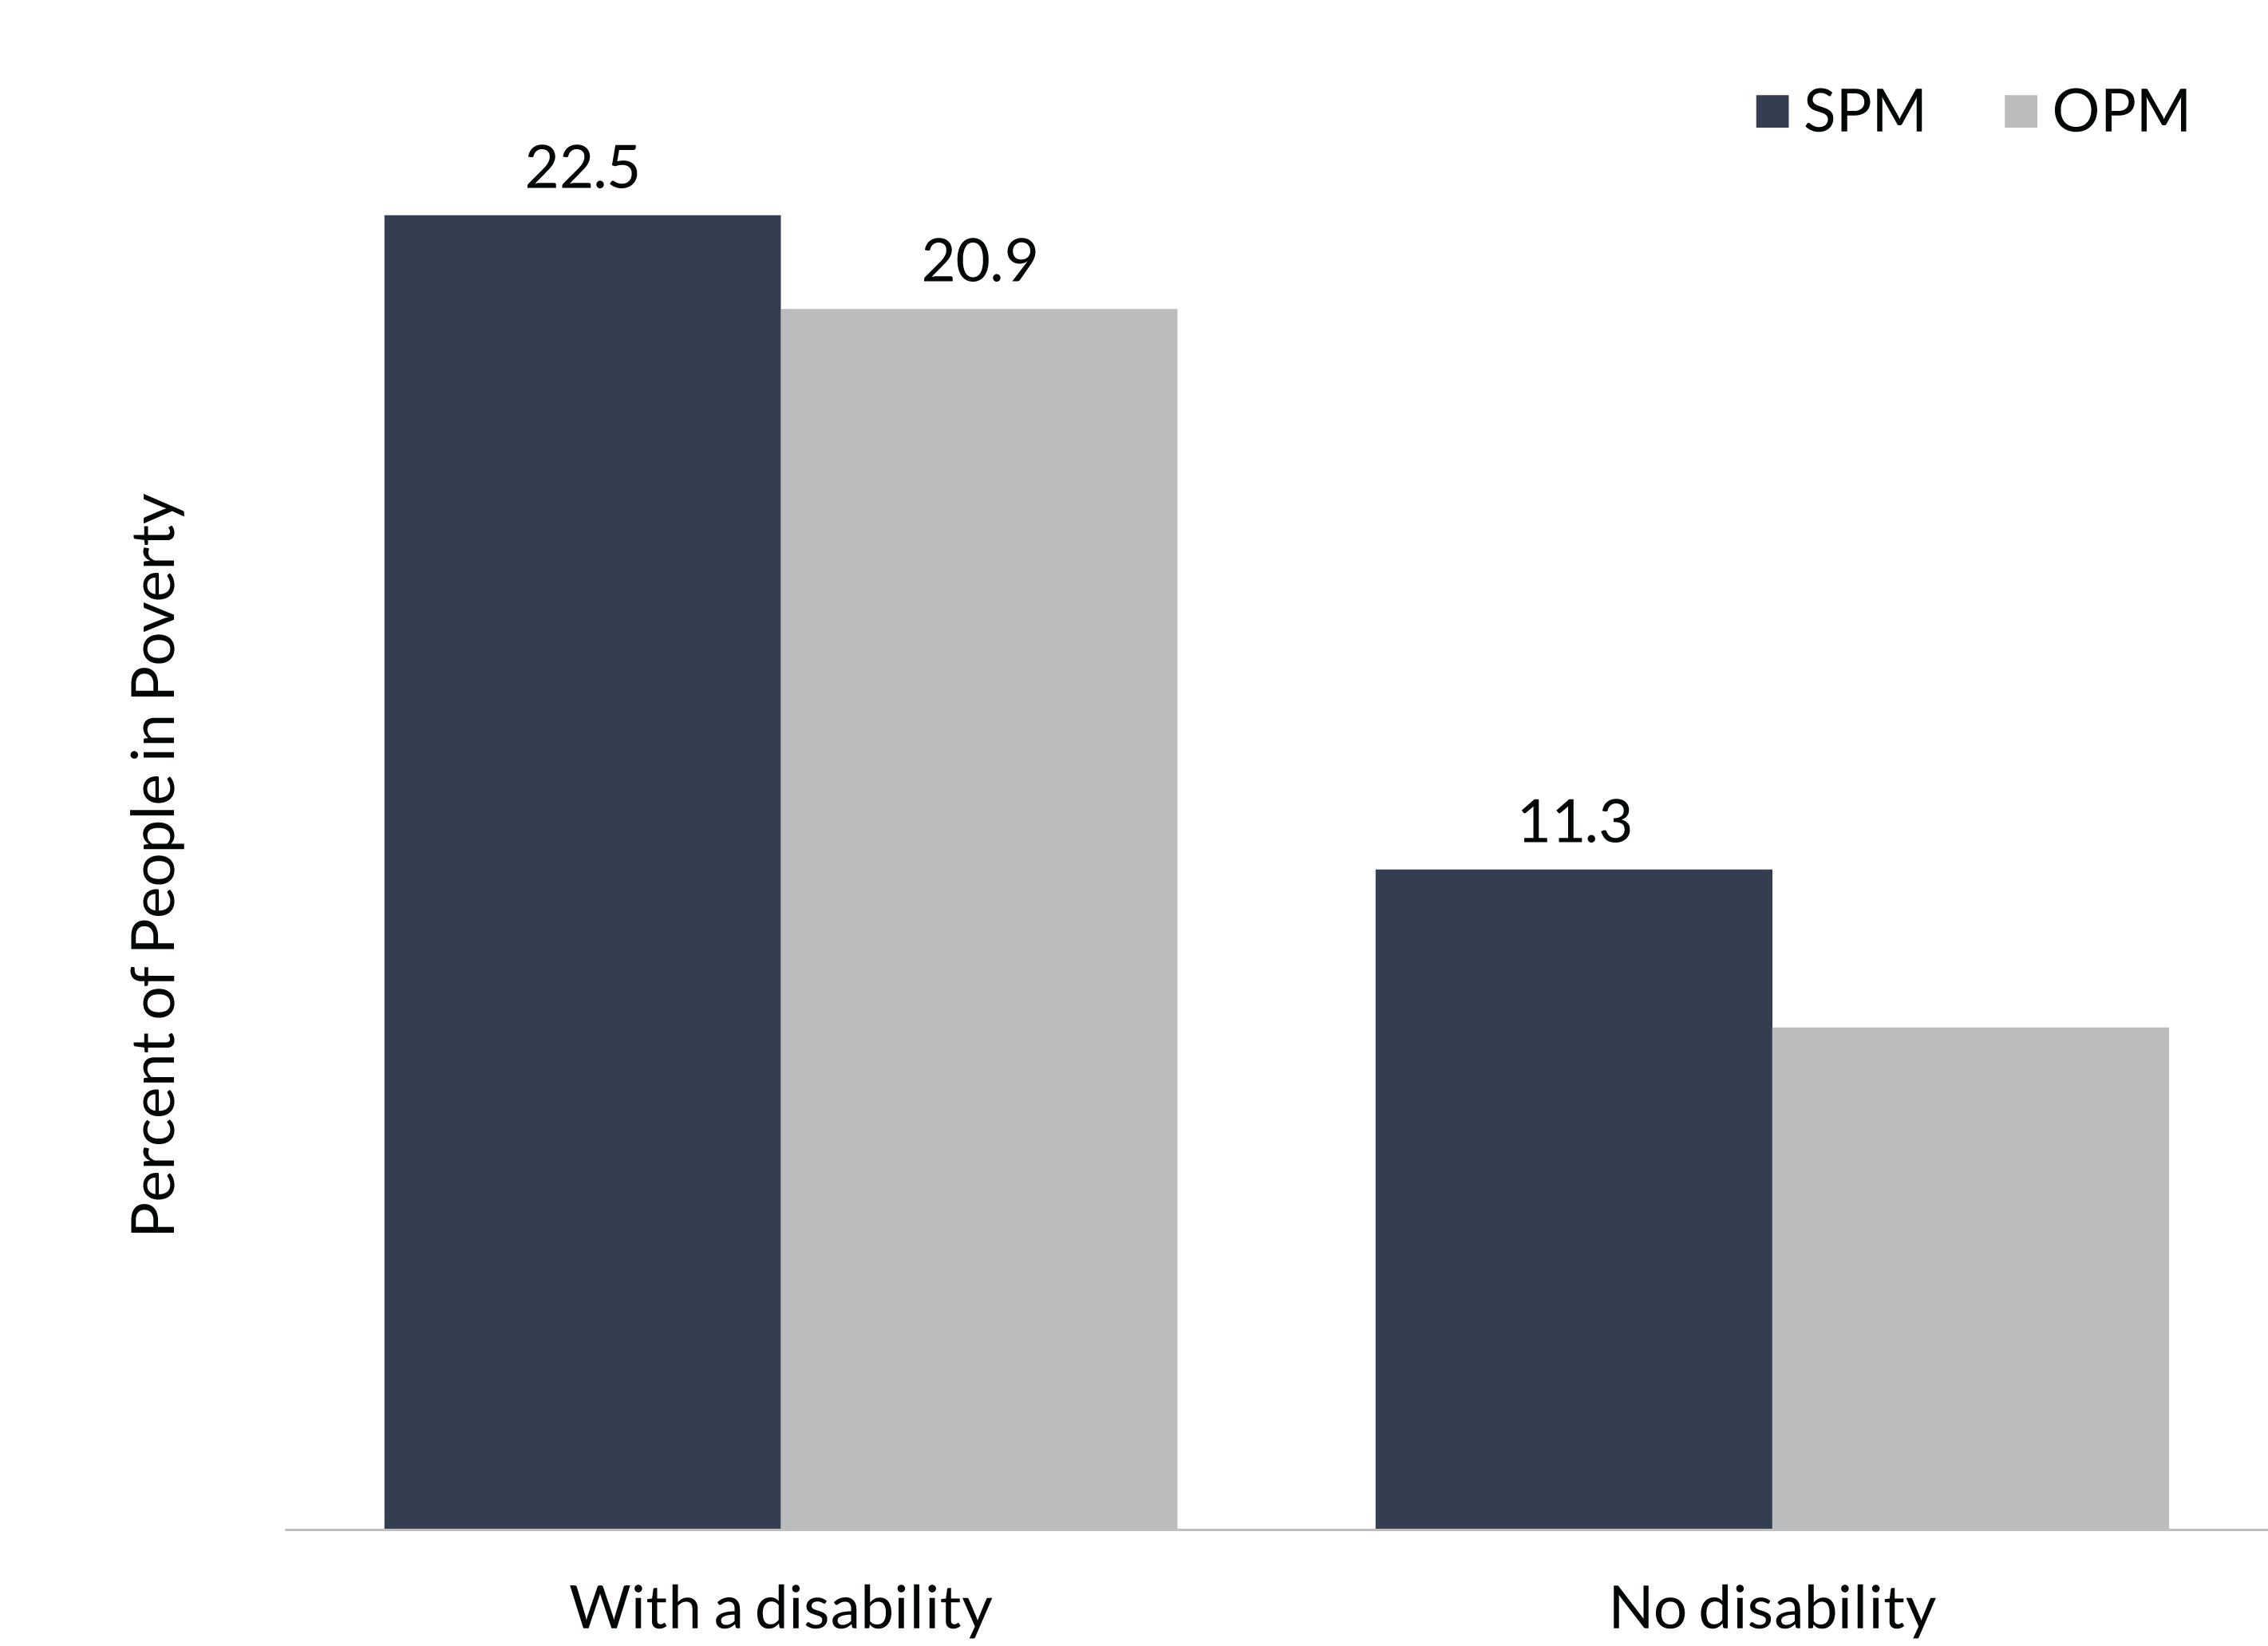
People living with a disability had a poverty rate of 22.5% (SPM) and 20.9% (OPM) in 2024. Poverty rates for people without a disability were significantly lower: 11.3% (SPM) and 8.6% (OPM).
Disability is a complex and multidimensional set of characteristics; its definitions and measures have evolved over time. The Census Bureau collects disability data primarily through the American Community Survey and the Survey of Income and Program Participation. Because definitions of disability can differ across survey instruments, caution is advised for comparisons results across surveys. For more on how the Census Bureau defines and measures disability characteristics, visit: https://www.census.gov/topics/health/disability/about.html
Source: U.S. Census Bureau. Poverty in the United States: 2024. (September 2025), Tables A-1 and B-3. https://www.census.gov/library/publications/2025/demo/p60-287.html
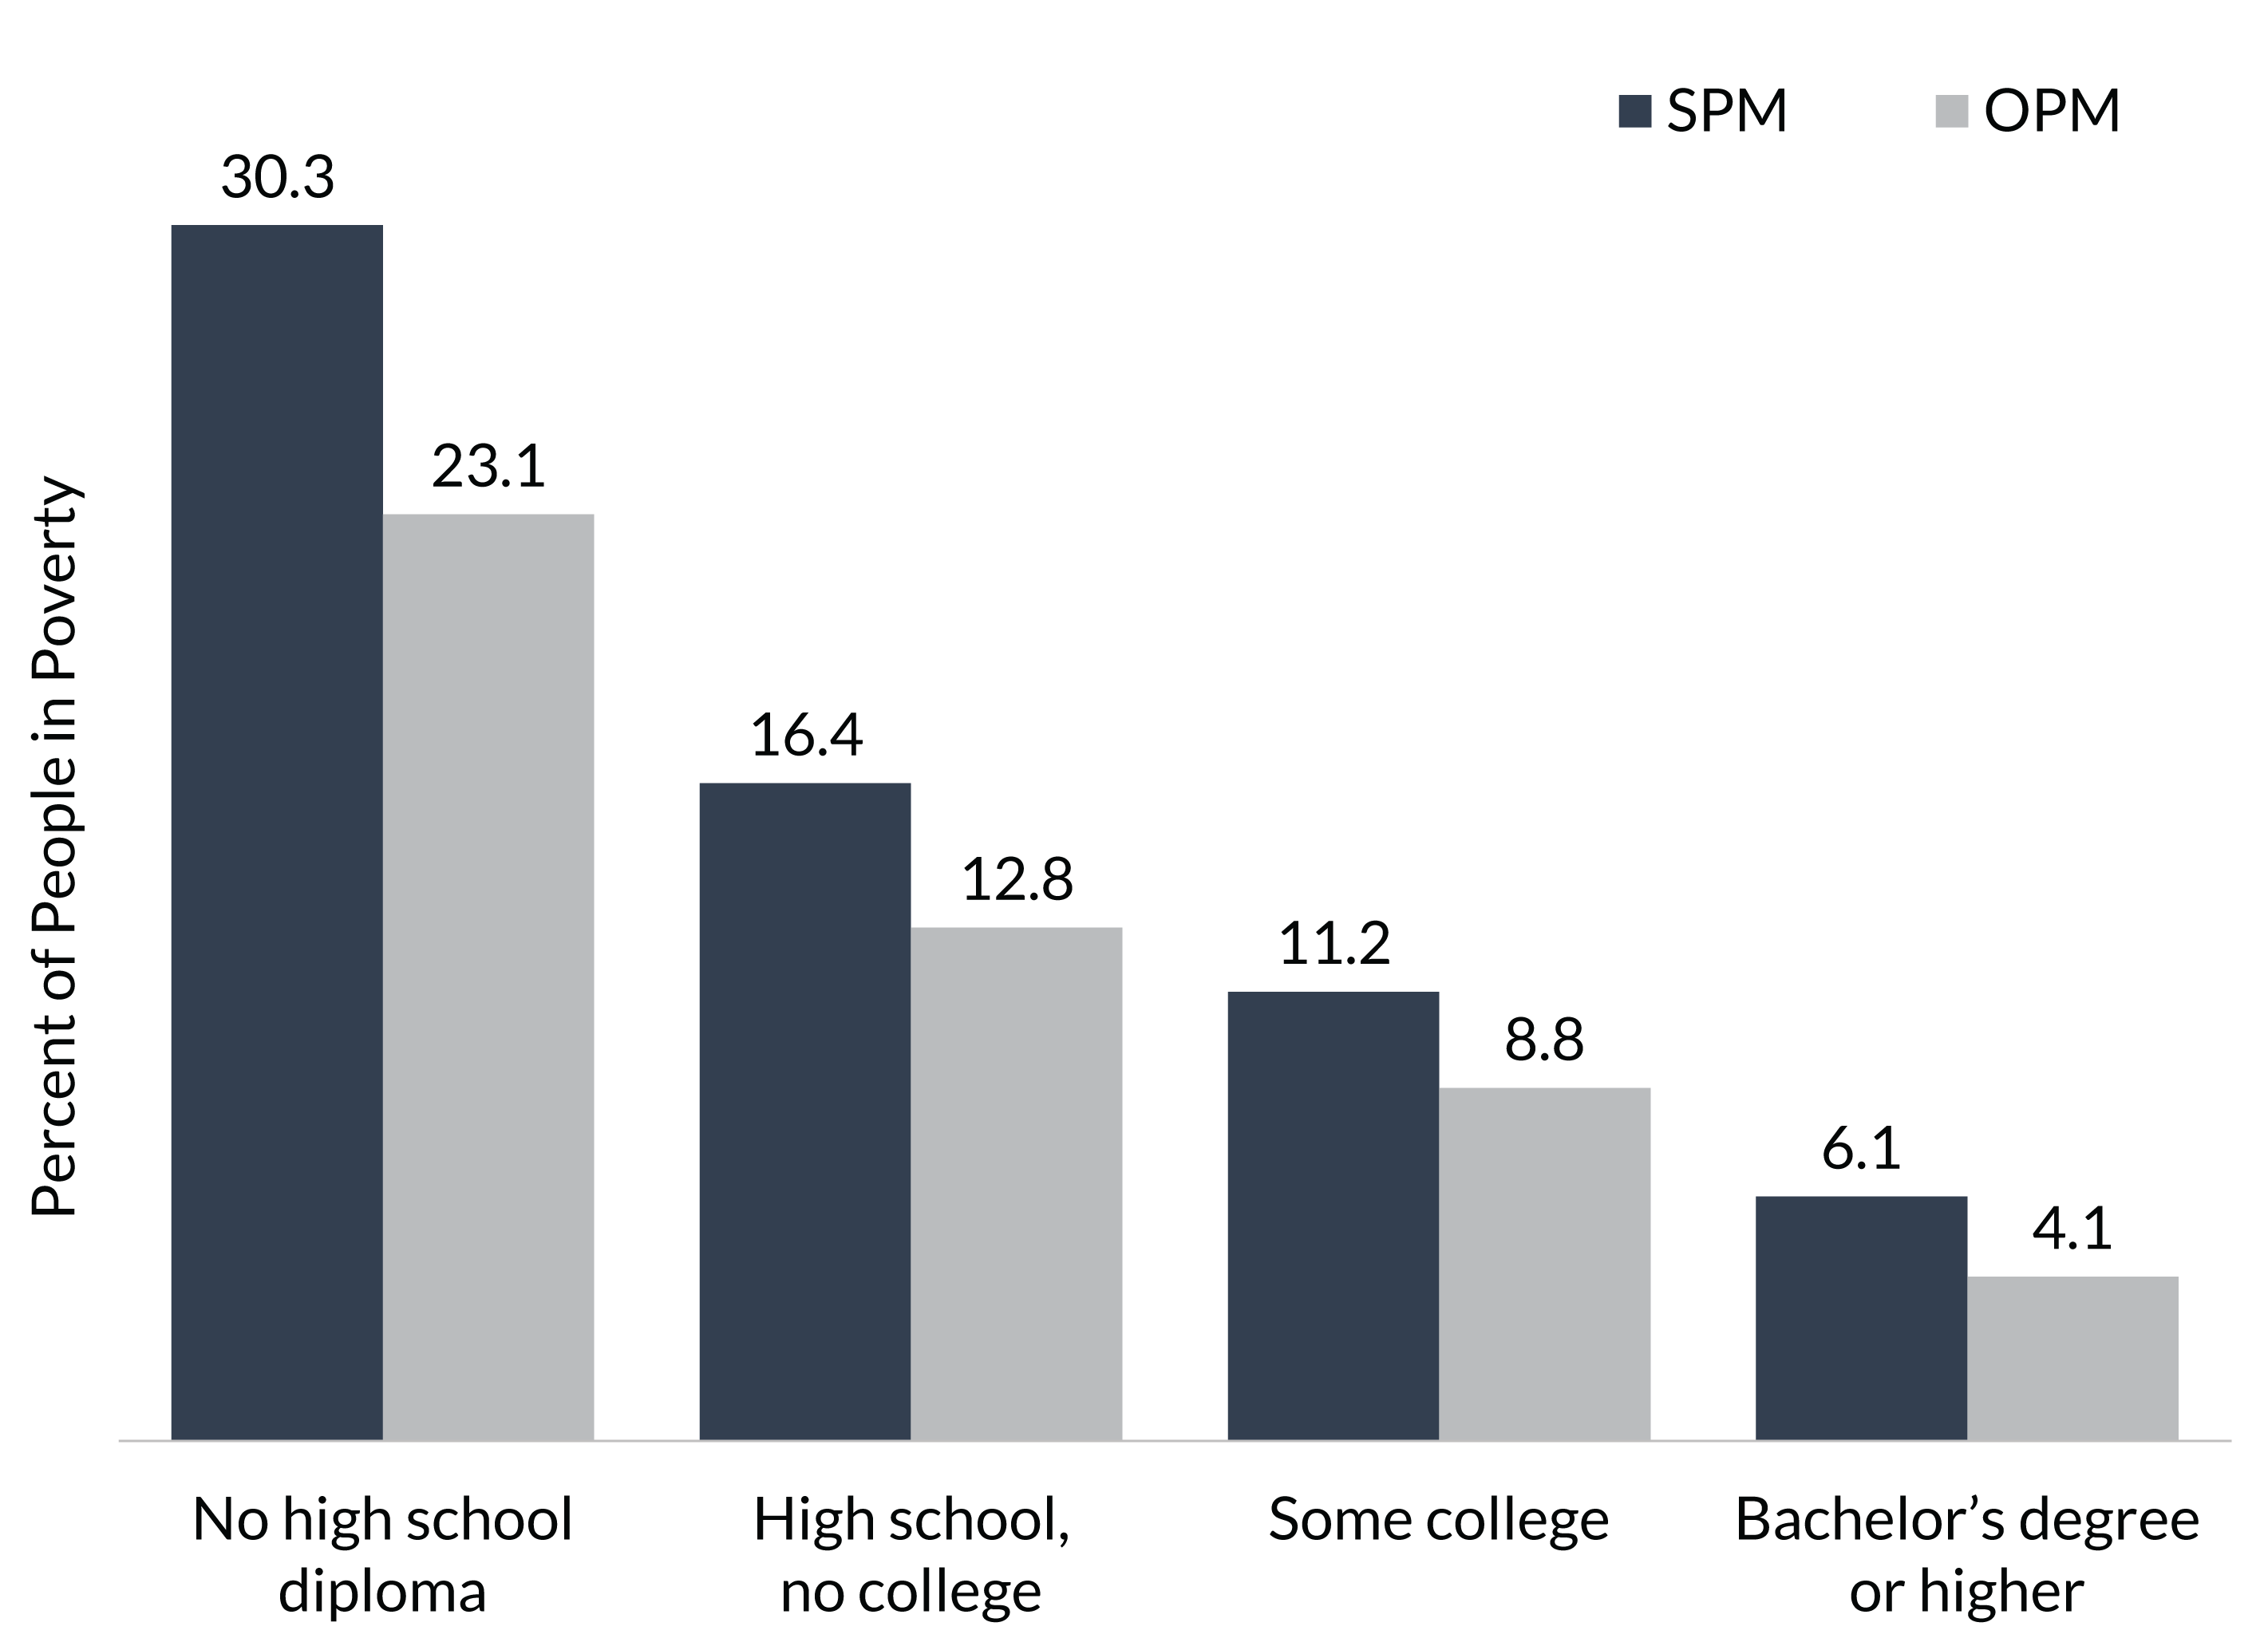
Among adults aged 25 years and older in 2024, those without a high school diploma had the highest poverty rate of 30.3% (SPM) and 23.1% (OPM). Those with a high school diploma experienced poverty at about half those rates, at 16.4% (SPM) and 12.8% (OPM). Those with a bachelor’s degree or higher experienced the lowest rates of poverty, at 5.9% (SPM) and 4.1% (OPM).
Source: U.S. Census Bureau. Poverty in the United States: 2024. (September 2025), Table B-4. https://www.census.gov/library/publications/2025/demo/p60-287.html