The U.S. Census Bureau calculates Small Area Income and Poverty Estimates (SAIPE) for single-year estimates of income and poverty for all U.S. states and counties. The SAIPE program also estimates poverty among children and adolescents, ages 5 to 17 years-old, for 13,000+ school districts nationwide.
The maps and corresponding table below represent counties in Wisconsin showing a range of poverty rates for all age groups (Figure 1) and school-age populations of 5 to 17 years-old (Figure 2). Figure 3 compares Wisconsin counties to the single-year (2024) state-average poverty rate of 10.3% (± 0.2%). Table 1 includes all county poverty numbers and percentages with margins of error (90% confidence interval).
All values are from the Small Area Income and Poverty Estimates program; visit their site for more information and interactive mapping tools.
- Who experiences poverty?
- Who in Wisconsin experiences poverty?
- How is poverty measured?
- What are poverty thresholds and poverty guidelines?
- What is the consumer price index and how is it used?
- What are good sources of information on basic trends in poverty and related issues?
- What are good sources of demographic and socioeconomic information for states, counties, and cities?
This is an accordion element with a series of buttons that open and close related content panels.
Figure 1: Over all Poverty in Wisconsin
The Census Bureau report Poverty in the United States: 2024 (issued September, 2025) lists the three-year (2022, 2023, 2024) average poverty rate for Wisconsin as 8.3% (± 1.4%) under the Official Poverty Measure (OPM) and 7.7% (± 1.1%) under the Supplemental Poverty Measure (SPM).
Wisconsin’s overall poverty rates in 2024 were lower than the nationwide three-year averages of 11.1% (OPM) and 12.7% (SPM). For differences between the OPM and SPM, visit our other FAQ: How Is Poverty Measured?
The U.S. Census Bureau Small Area Income and Poverty Estimates (SAIPE) are single-year estimates and demonstrate differences between county-level and other “small area” poverty rates.
Figure 2: Child Poverty in Wisconsin
U.S. Census Bureau calculates Small Area Income and Poverty Estimates (SAIPE) to better understand poverty in smaller areas and other demographic groups. The SAIPE calculation for Wisconsinites under age 18 experiencing poverty in 2024 was 12.2% (± 0.7%) or an estimated average of 148,381 Wisconsin children and adolescents.
In a similar calculation for school-age children (5 to 17 years old) living with their families, the estimated 2024 poverty rate in Wisconsin was 11.3% (± 0.8%) or about 102,888 Wisconsin children and adolescents.
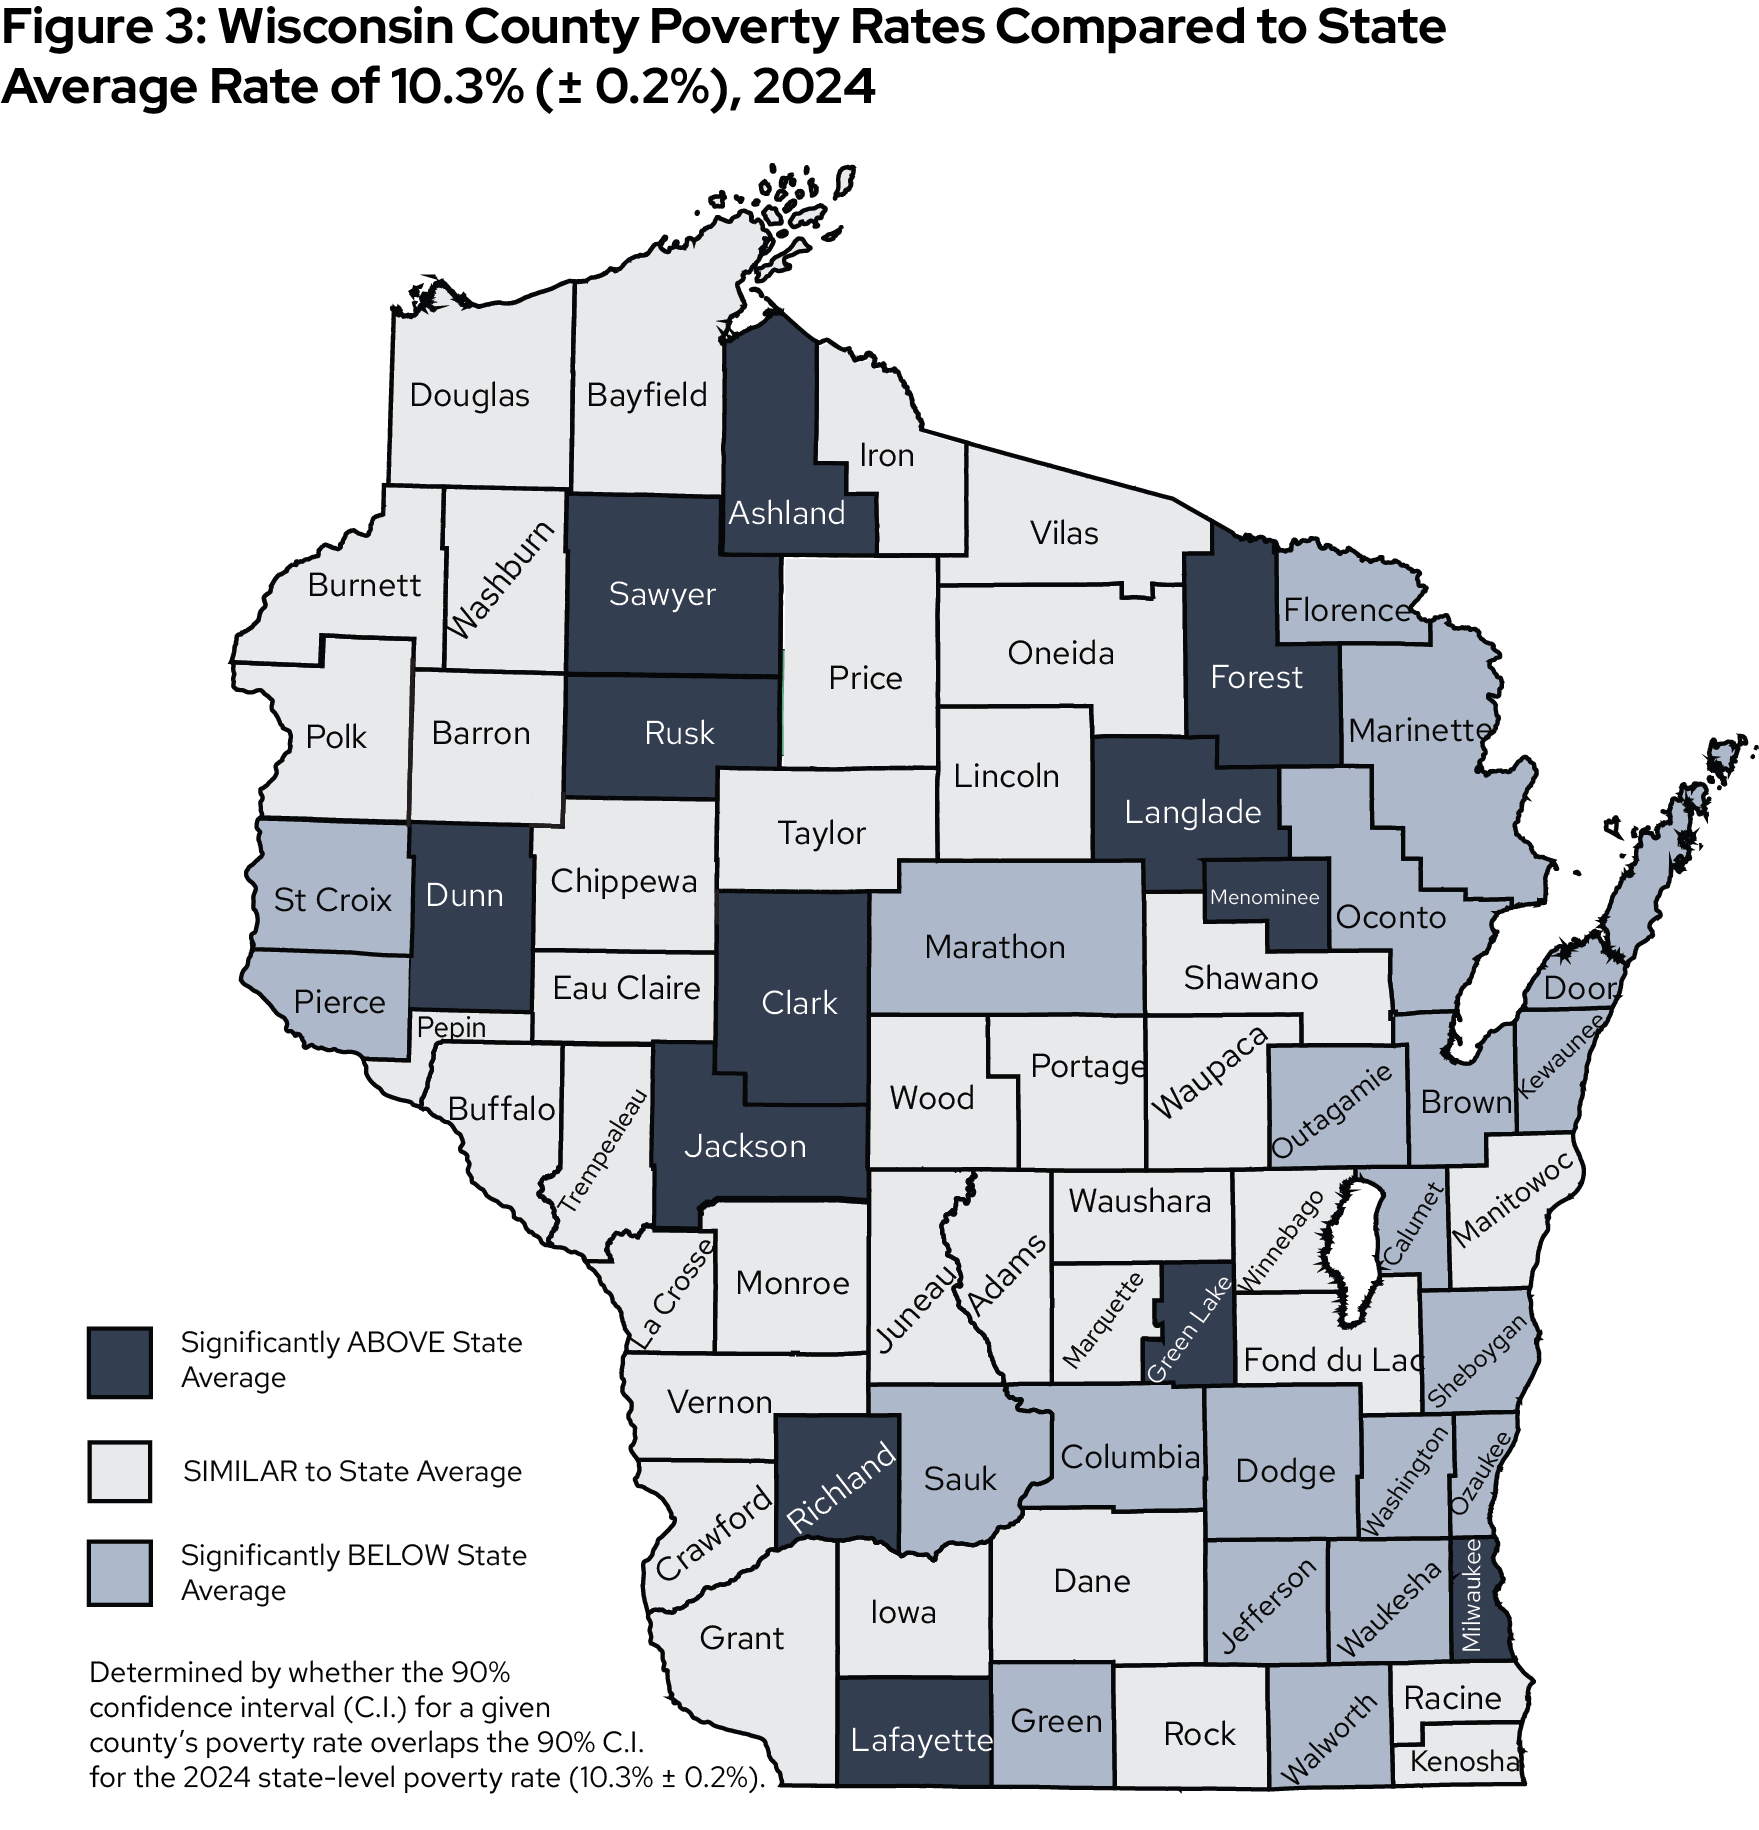
Figure 3: County Poverty Rates
Using the U.S. Census Bureau Small Area Income and Poverty Estimates (SAIPE) we can compare county-level poverty rates to the overall state rate of 10.3% (± 0.2%) in 2024. Thirteen counties spanning the state from urban southeast to rural northwest, central, and southwest Wisconsin had SAIPE poverty rates averaging 14.7% (± 2.4%). We can also calculate average county poverty rates significantly below the overall state level. The sixteen counties showing fewer people in poverty, on average, cluster in the eastern third of the state and include a few south-central counties as well as two counties closest to the Twin Cities of Minnesota. These counties show an average poverty rate of 7.1% (± 1.3%).
https://www.census.gov/data-tools/demo/saipe/#/?s_state=55&s_county=&s_district=&s_geography=county