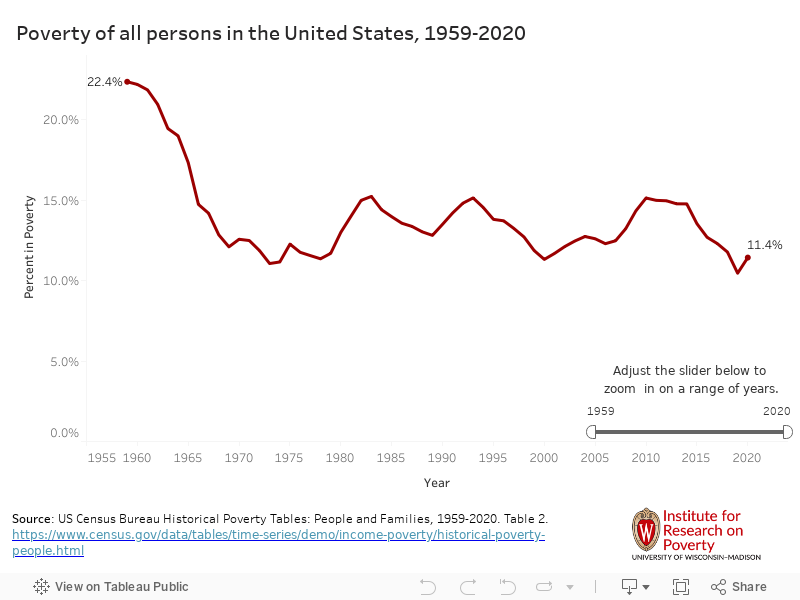
The most recent official poverty measure estimates show that 11.8% of the population of the United States, 38.1 million people, was poor in 2018. The graph below shows the rate of poverty over time for the United States, from 1959 to 2018. This page goes on to show the rates of poverty by a number of demographic and geographic subgroups.
The official poverty rate when it was first measured in 1959 was 22.4%; then, after a major decline over the 1960s, poverty has hovered between roughly 10% and 15%.
Poverty Rates by Demographic Subgroups
The U.S. Census Bureau releases annual estimates of poverty by various subgroups in the United States. Below, this section describes each of these groups for the year 2018:
- Age: Children had the highest poverty rate of the three major age groups: children under 18 (16.2%), adults aged 18-64 (10.7%), and seniors aged 65 and older (9.7%).U.S. Poverty Rate by Age
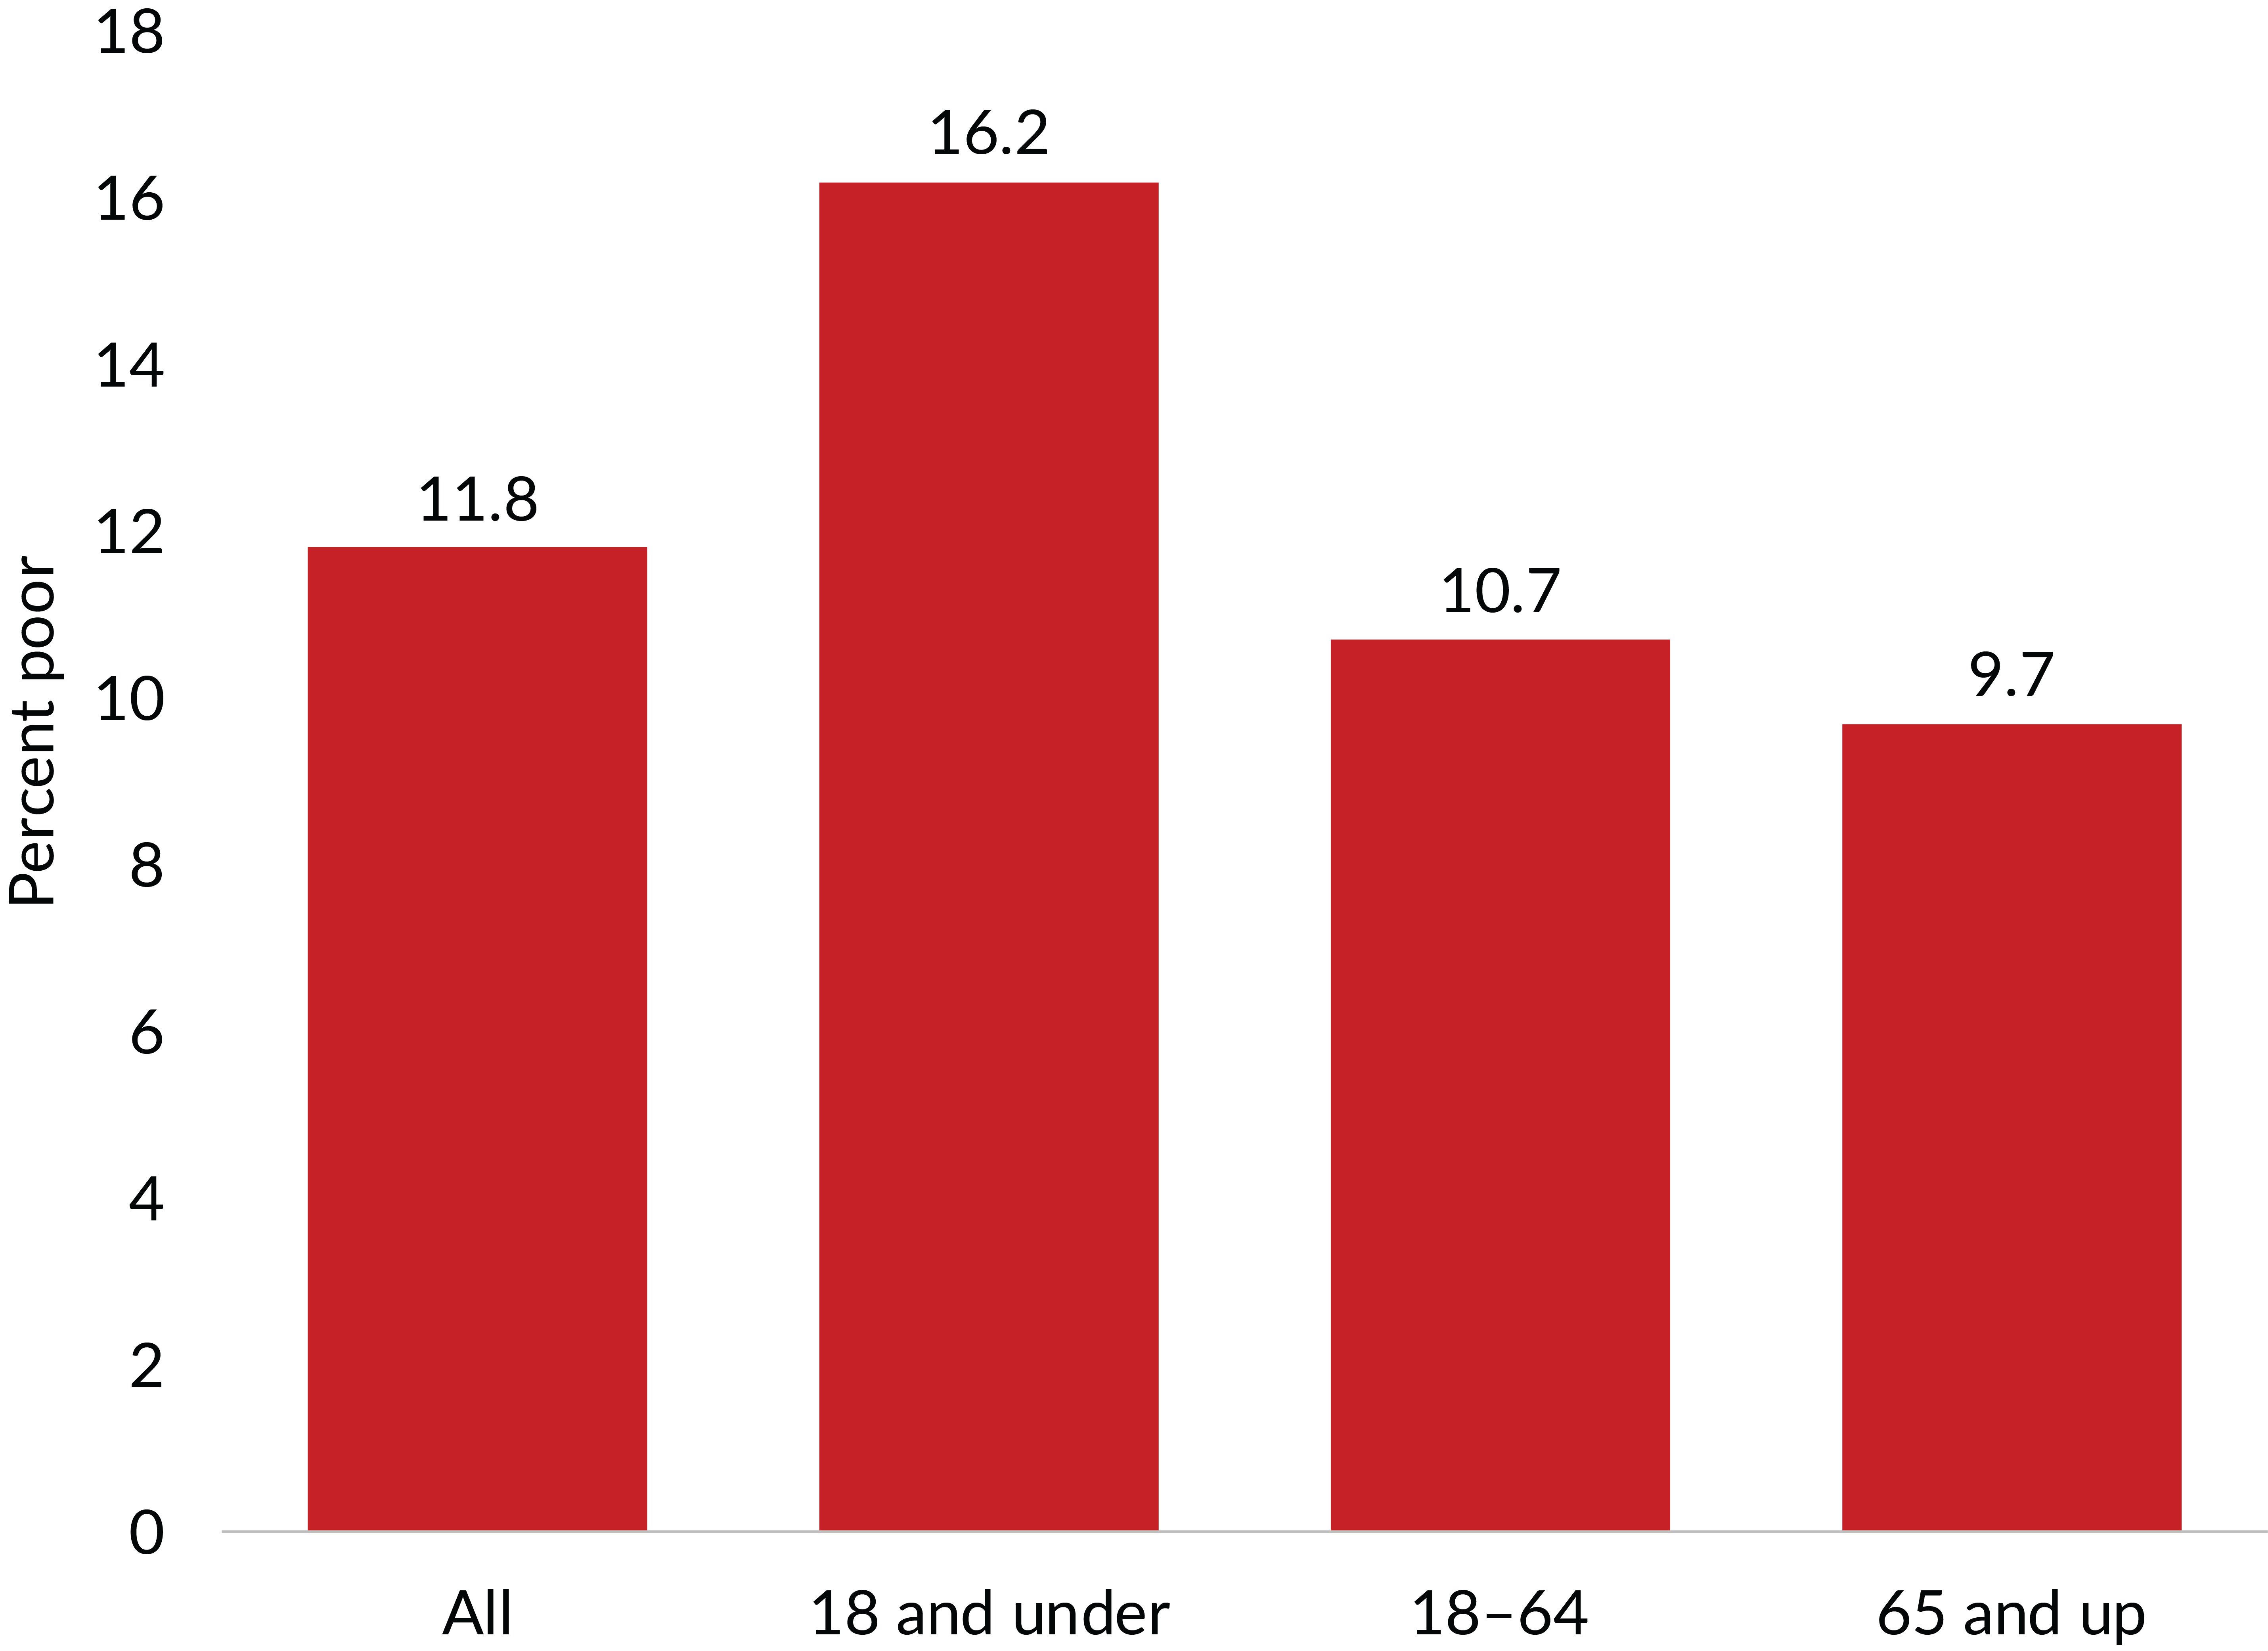
Figure 2. The U.S. poverty rate in 2018 was highest among children and lowest among elders.
Source: U.S. Census Bureau, Income and Poverty in the United States: 2018. Table B-1, p. 50. - Age and sex: When considering the difference in poverty between male and female Americans by age, among adults, poverty was higher among women. The poverty rate for those over age 18 was about 3 percentage points higher among women than men.U.S. Poverty Rates by Age and Sex
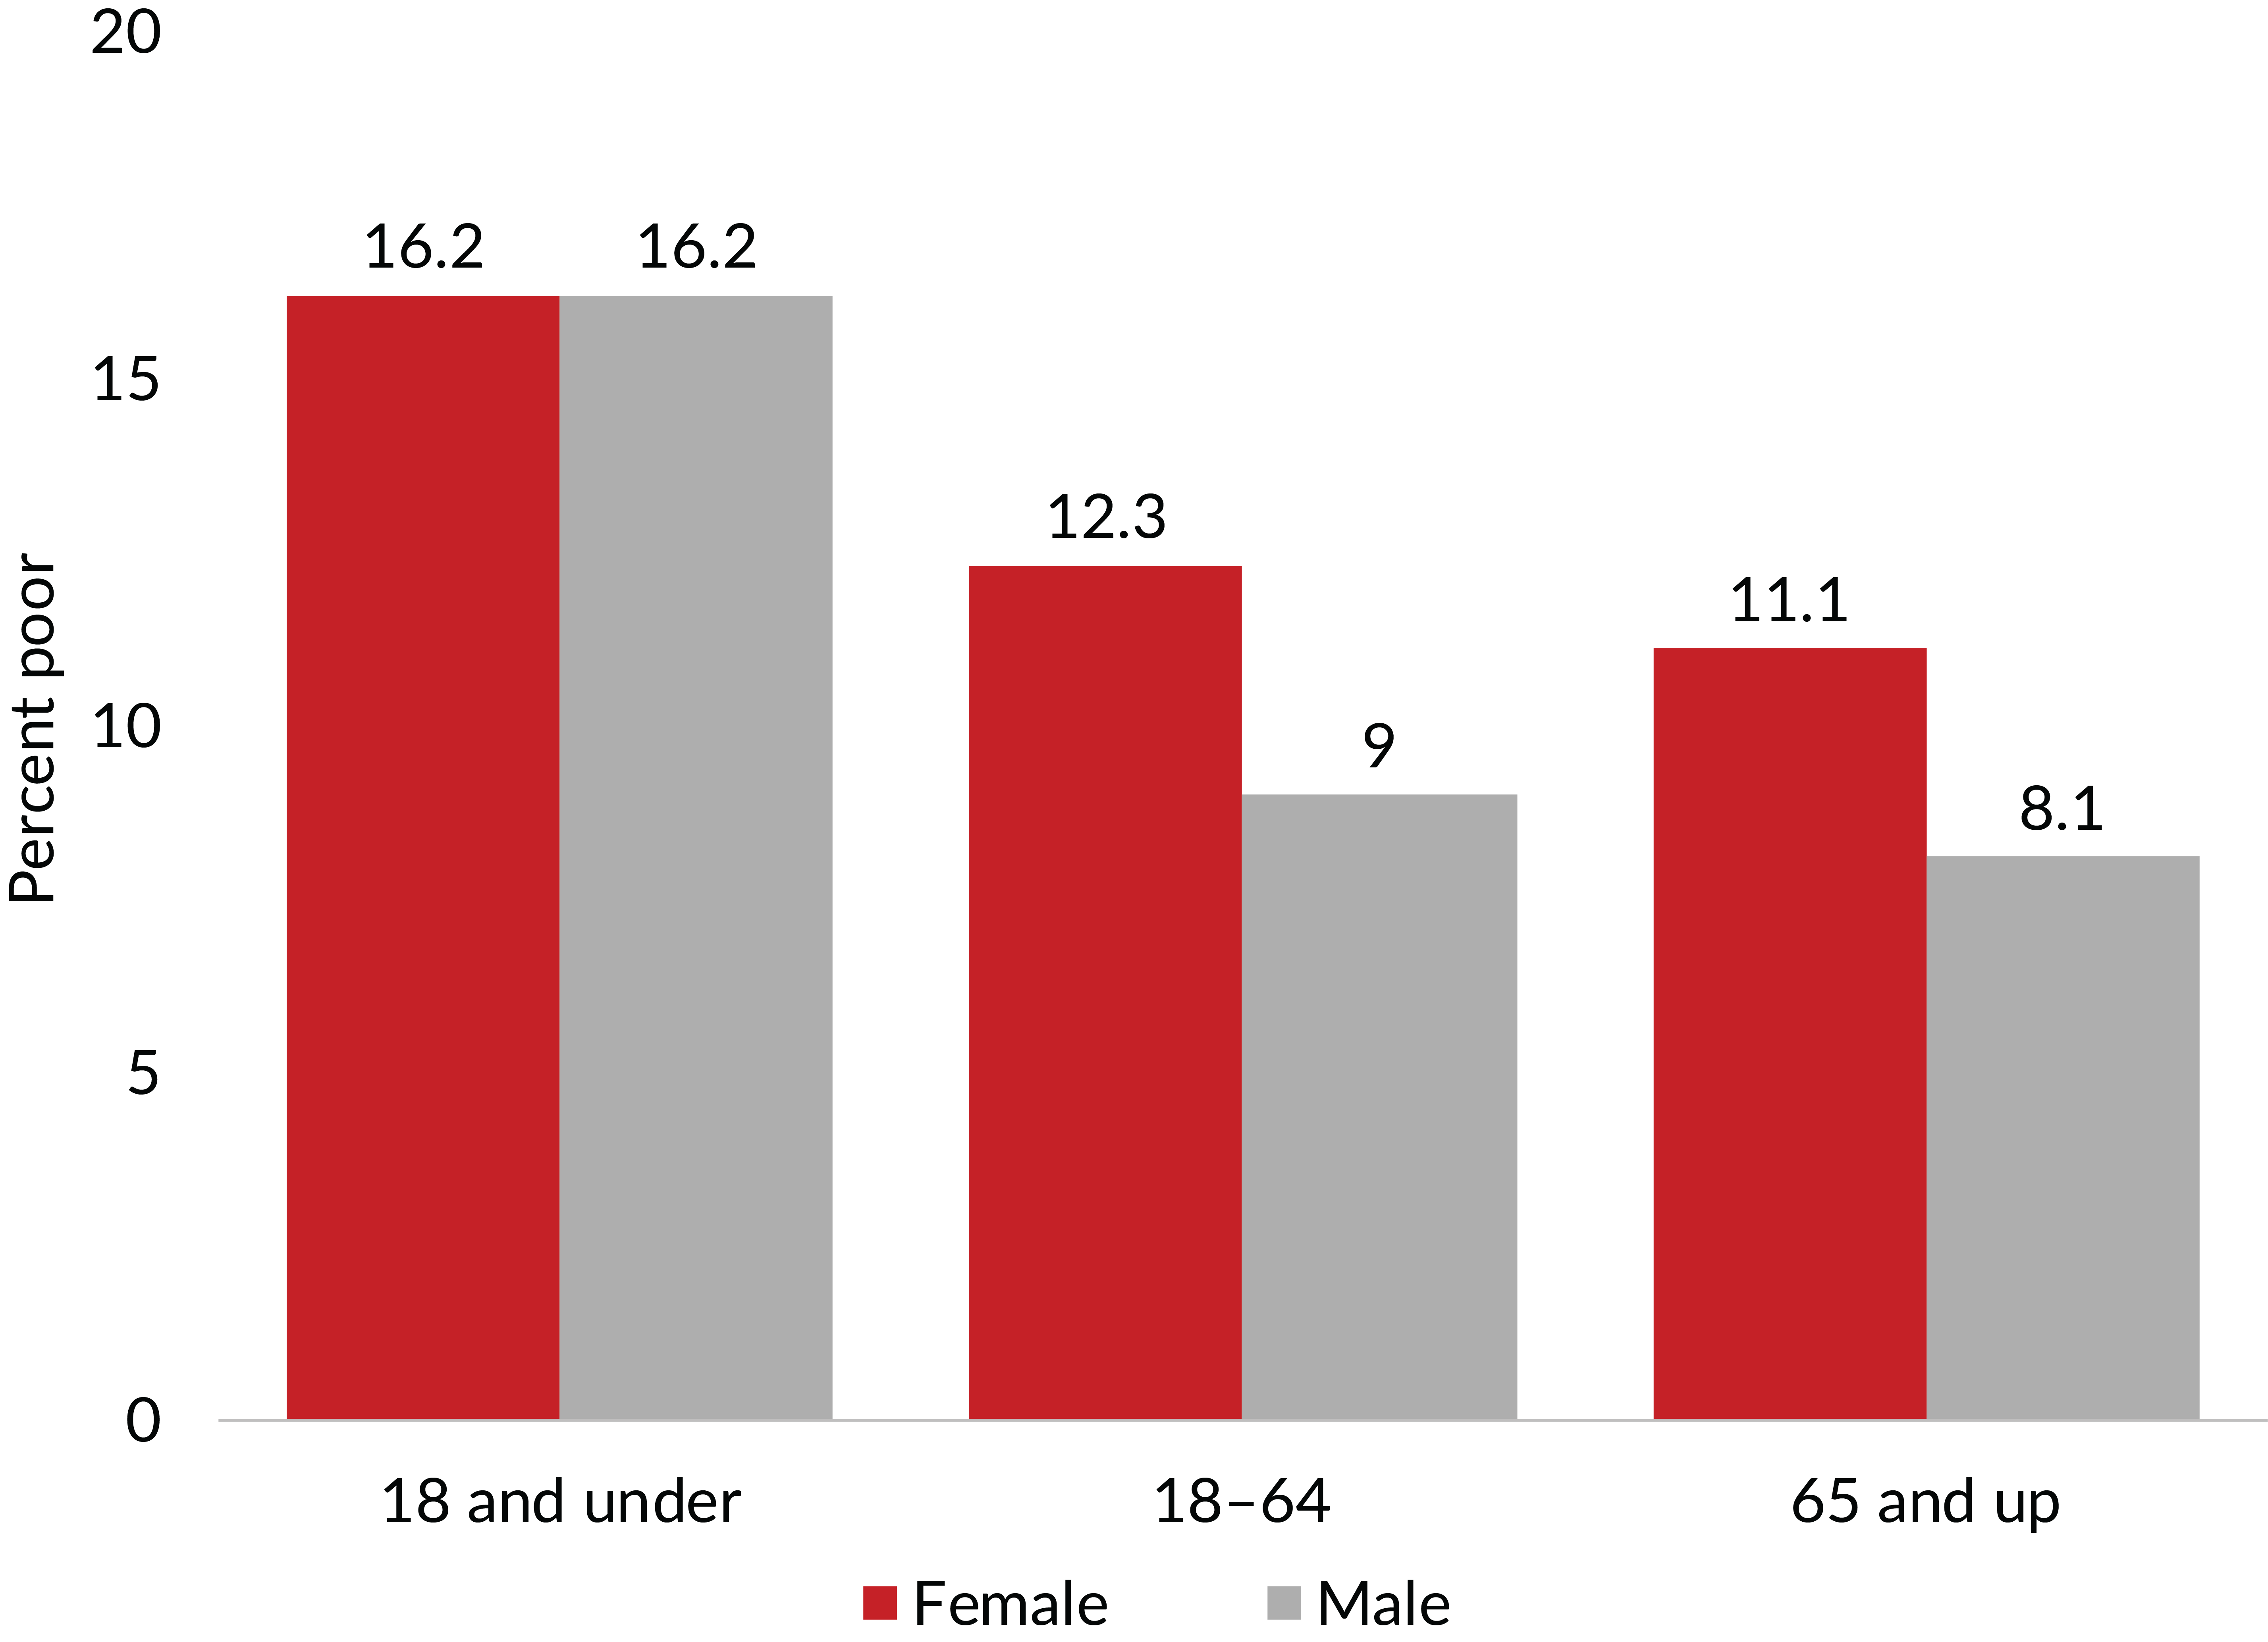
Figure 3. Poverty rates differed most between sexes among adults in 2018.
Source: U.S. Census Bureau, Income and Poverty in the United States: 2018. Figure 10, p.15. - Race and ethnicity: African Americans had the highest rate of poverty among the four groups of White (non-Hispanic), African American, Hispanic, and Asian. The poverty rate among African Americans was 20.8%.
U.S. Poverty Rates by Race/Ethnicity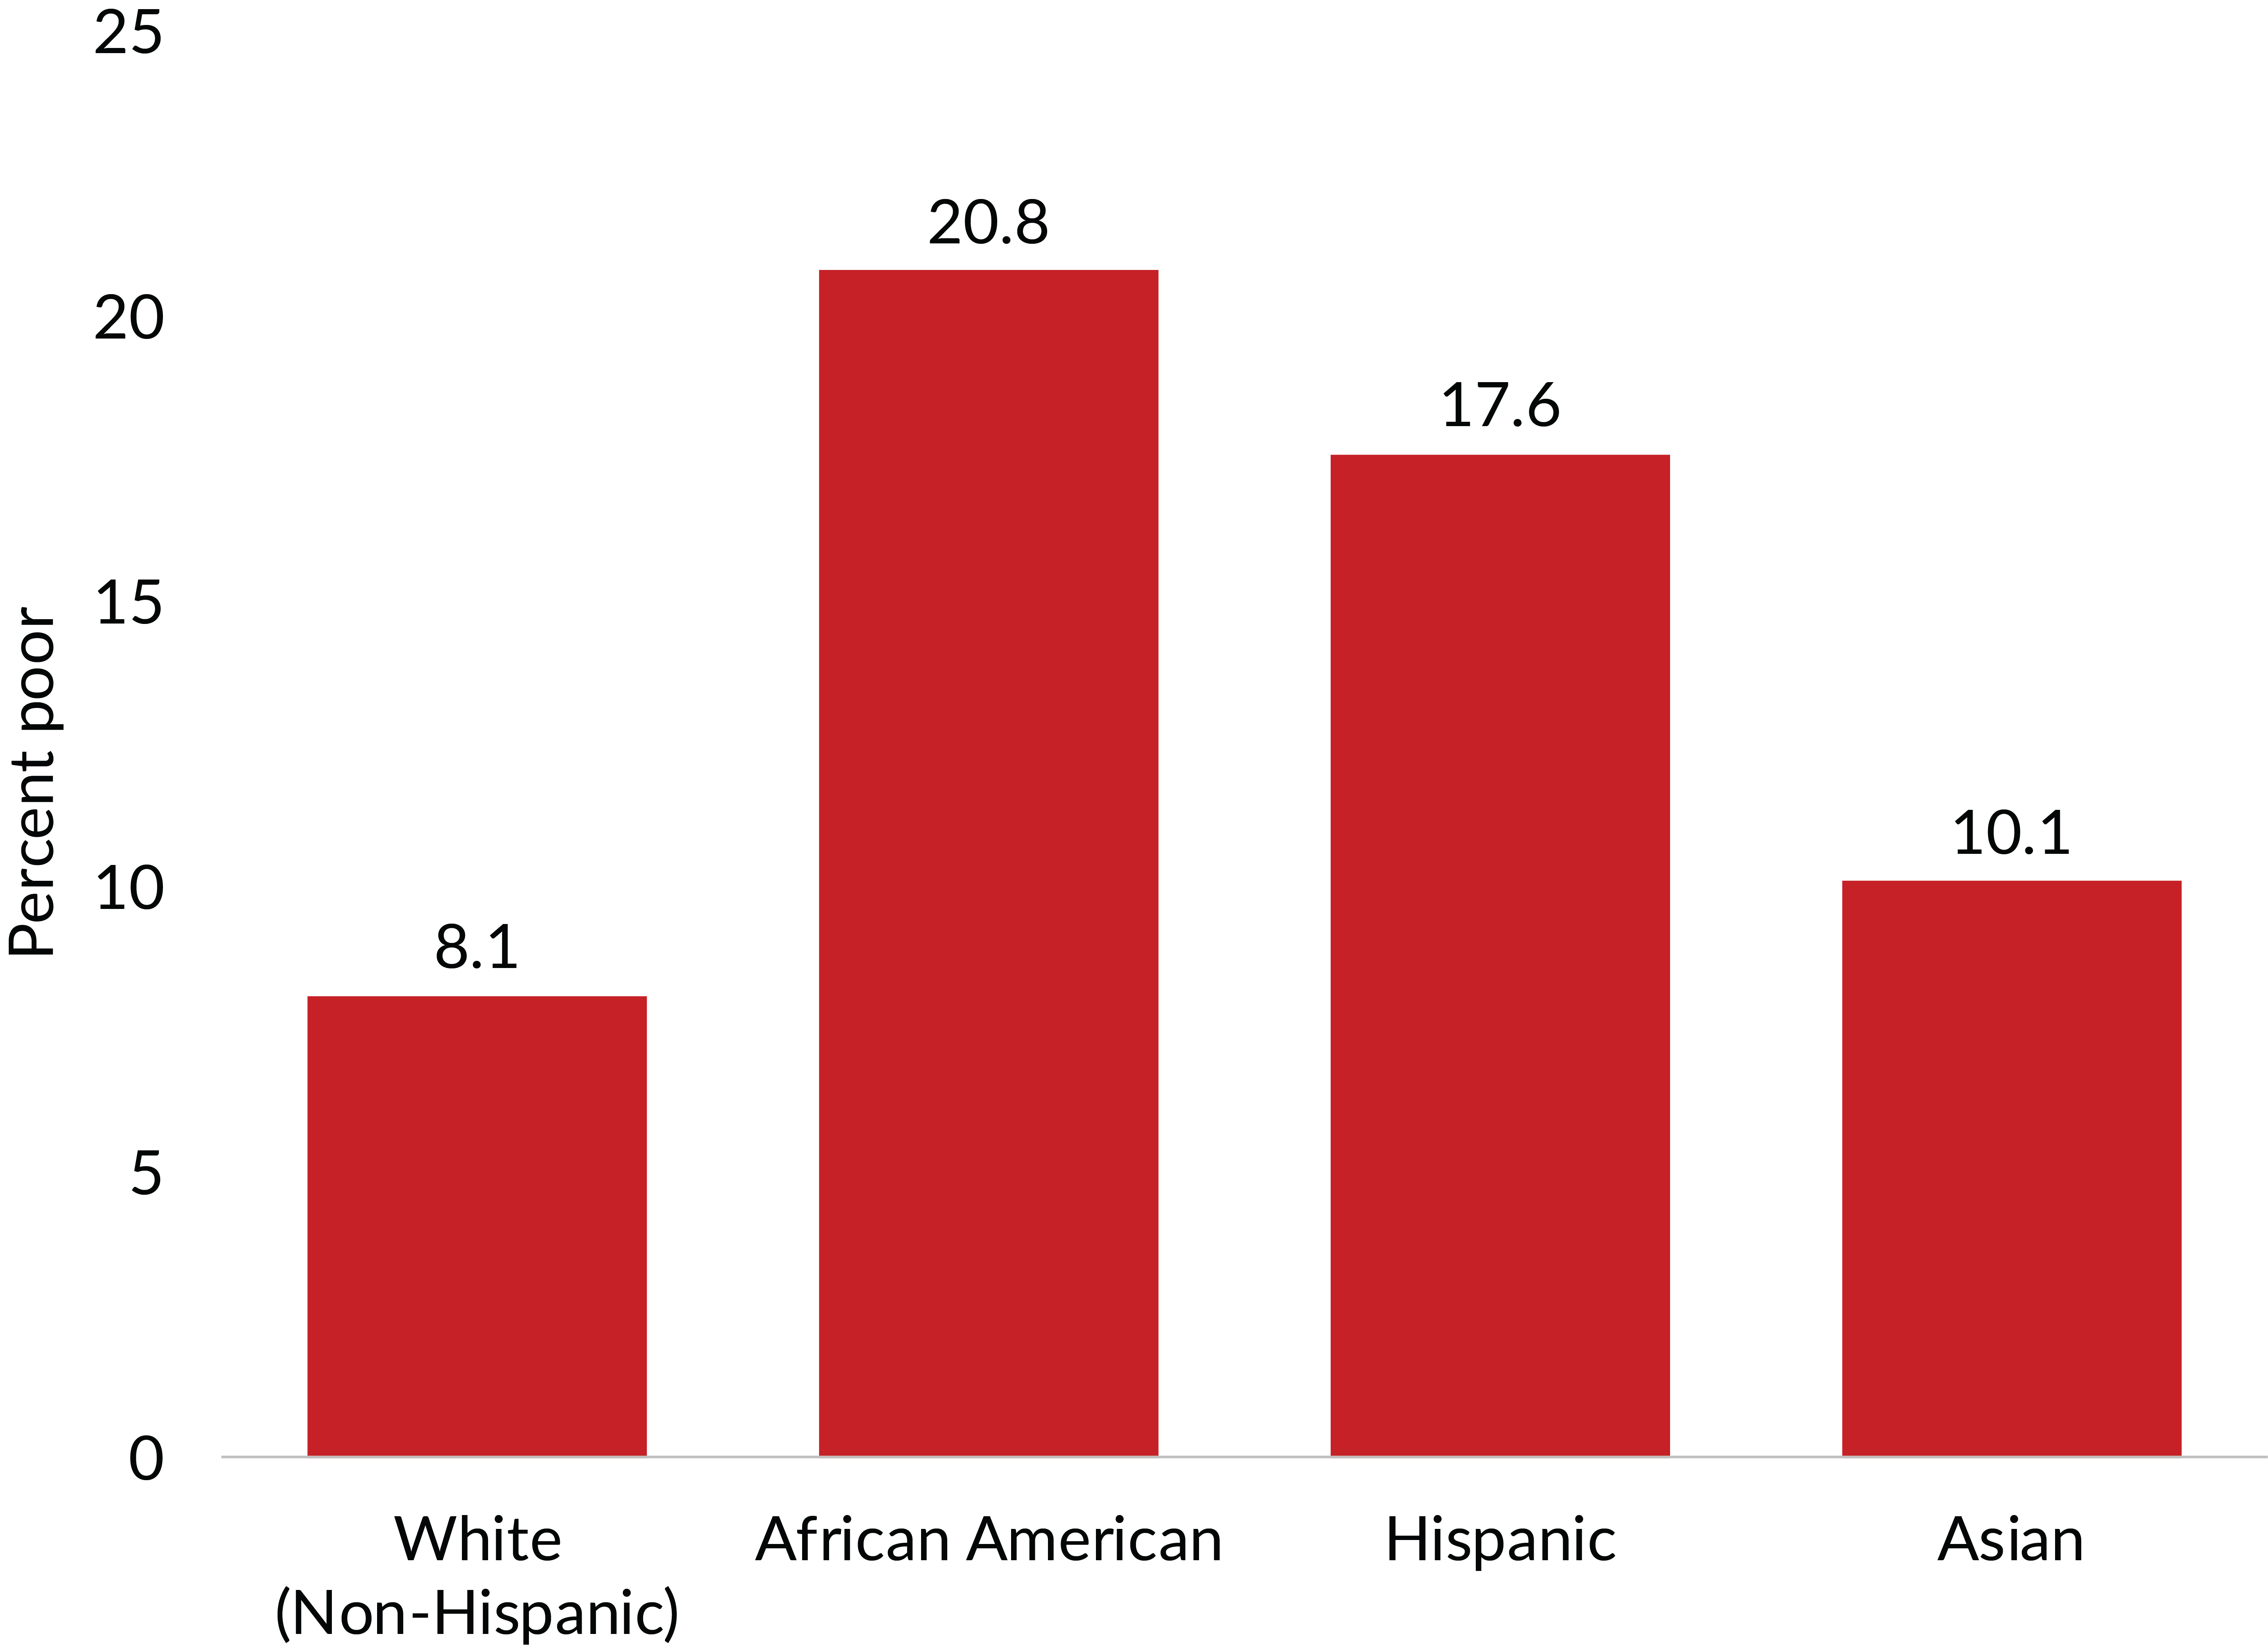
Figure 4. Poverty rates among African Americans were more than twice those of non-Hispanic white and Asian Americans in 2018.
Source U.S. Census Bureau, Income and Poverty in the United States: 2018. Table B-1, p. 50. - Family composition: Among different family types (married couple, single mother, and single father), single-mother families had the highest poverty rate at 24.9%.
U.S. Poverty Rates by Family Type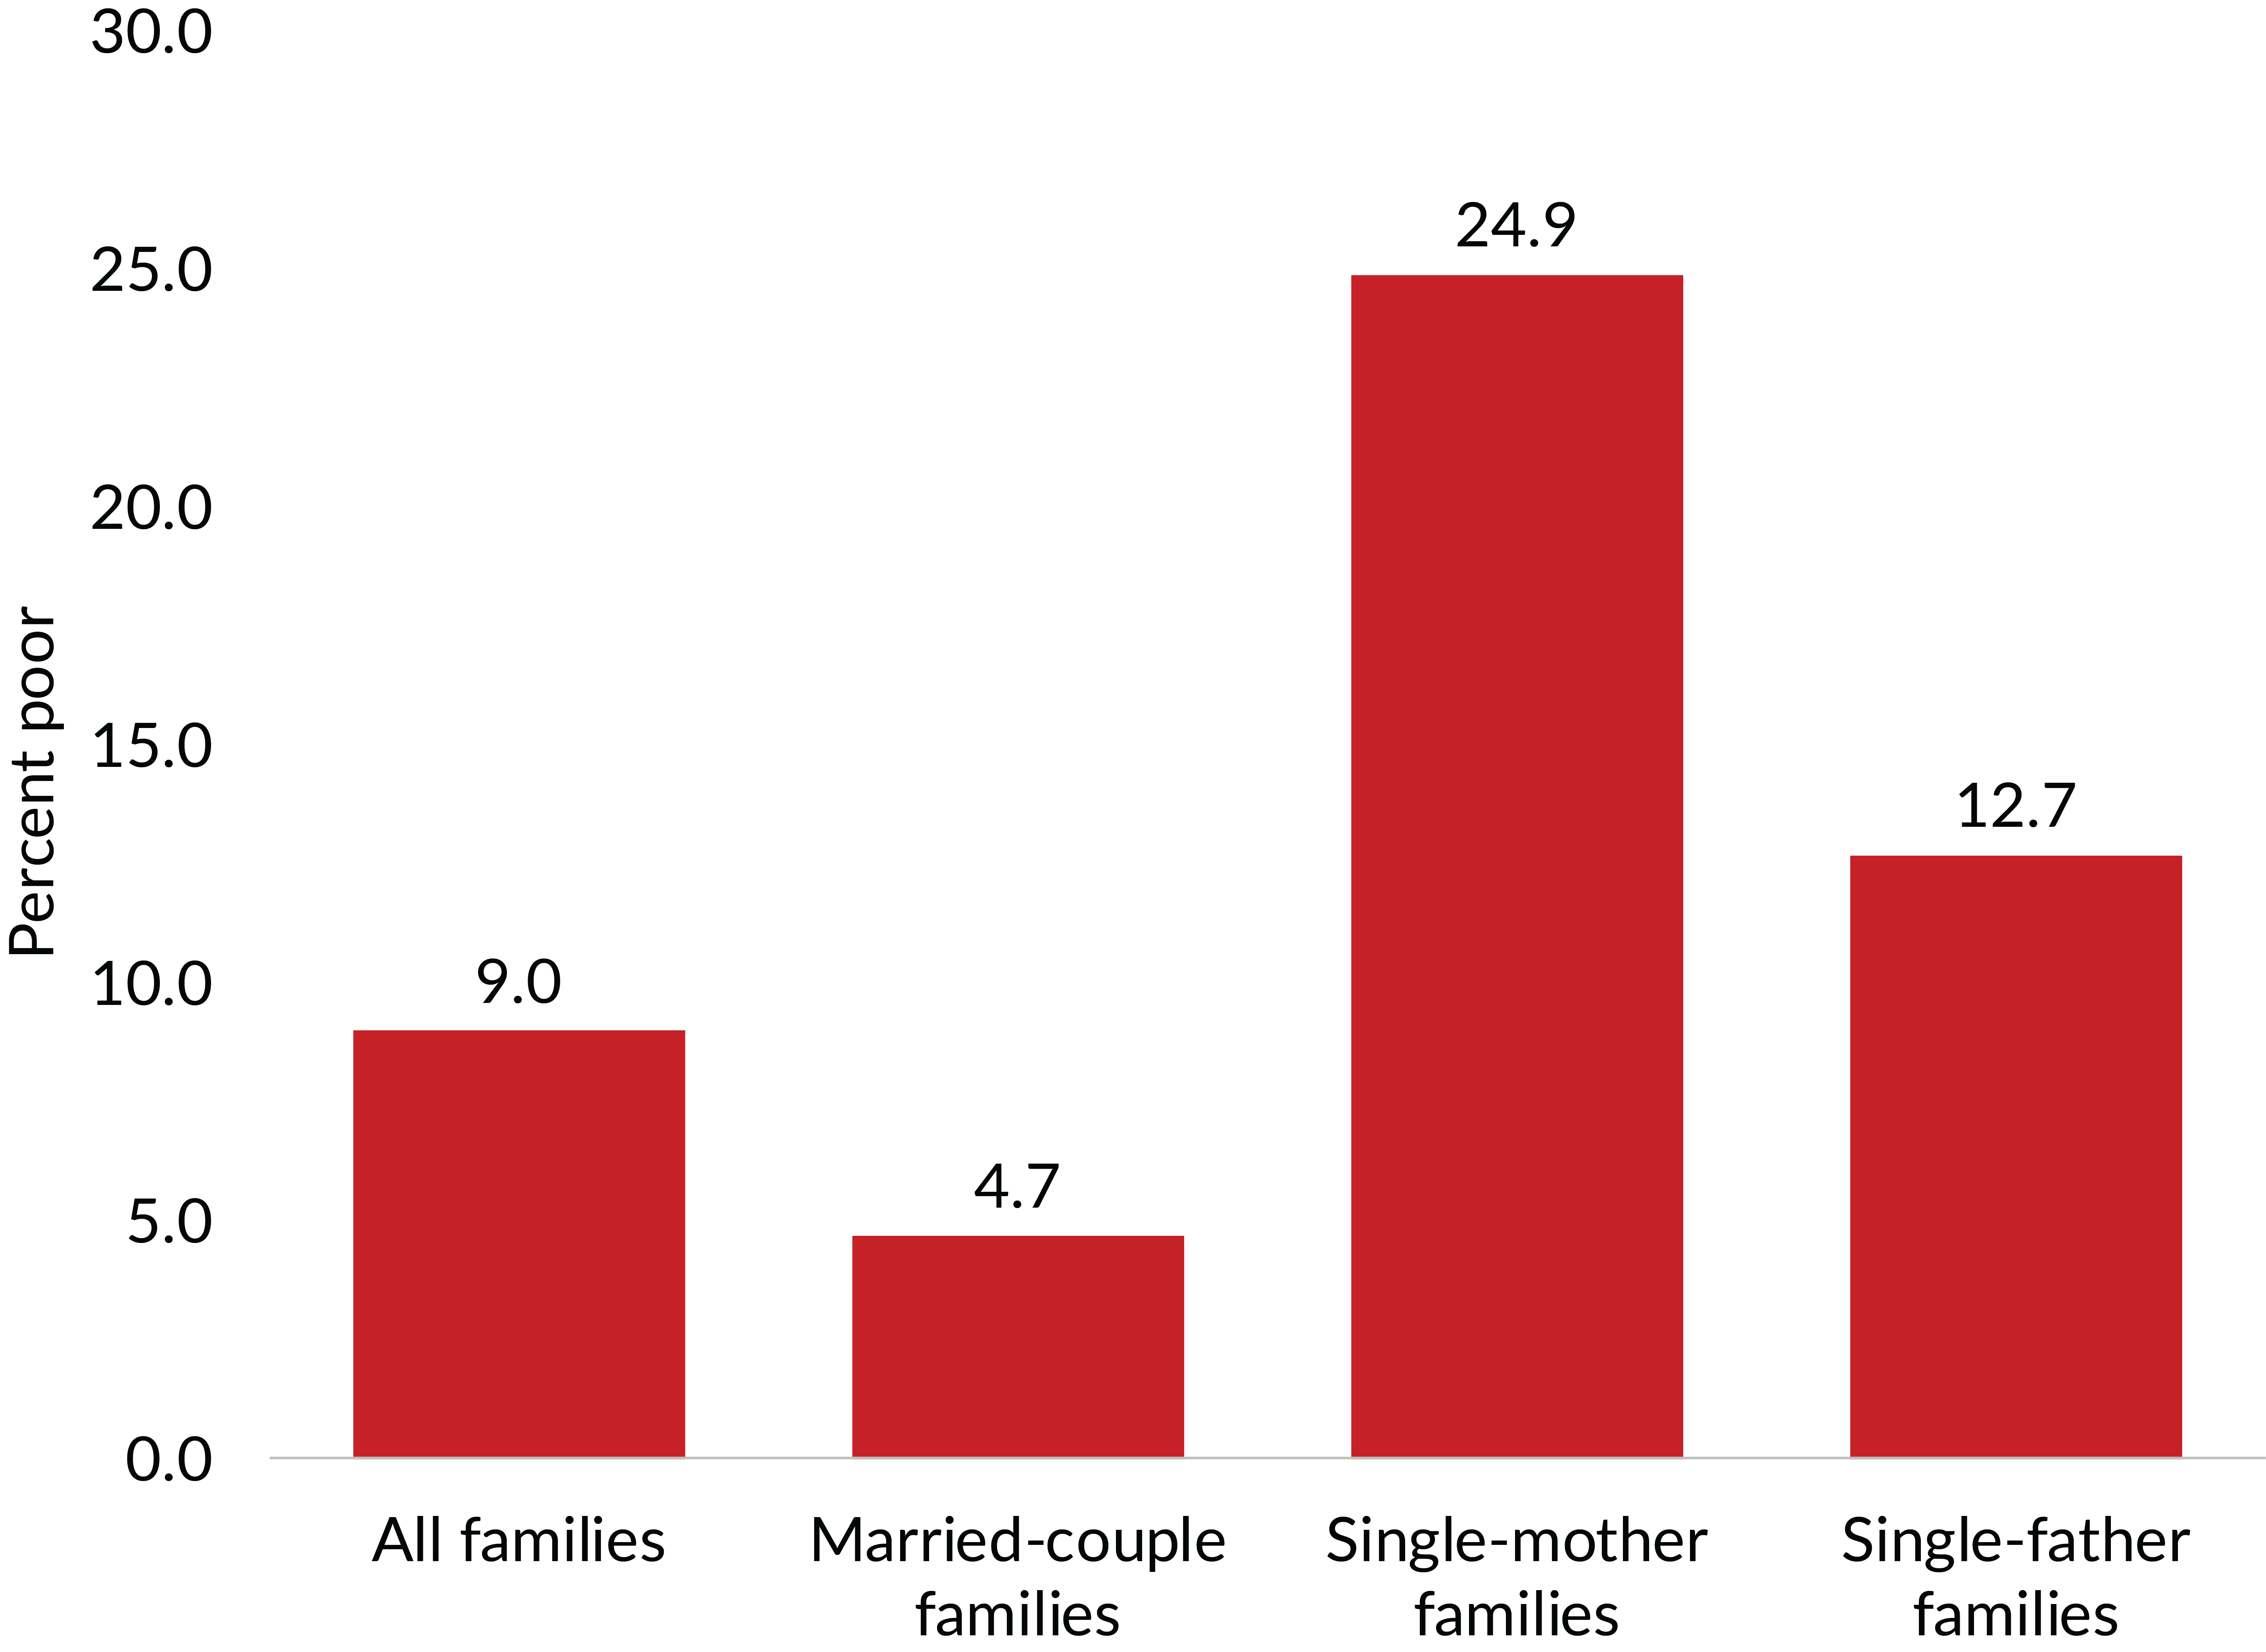
Figure 5. Poverty among single-parent families, especially those headed by a single mother, was highest among family types in 2018.
Source: U.S. Census Bureau, Income and Poverty in the United States: 2018. Table B-2, p. 51. - Poverty rates differ by region of the United States, with the South having a higher rate than the Northeast, Midwest, and West in 2018, as shown in Figure 6.
U.S. Poverty Rates by Region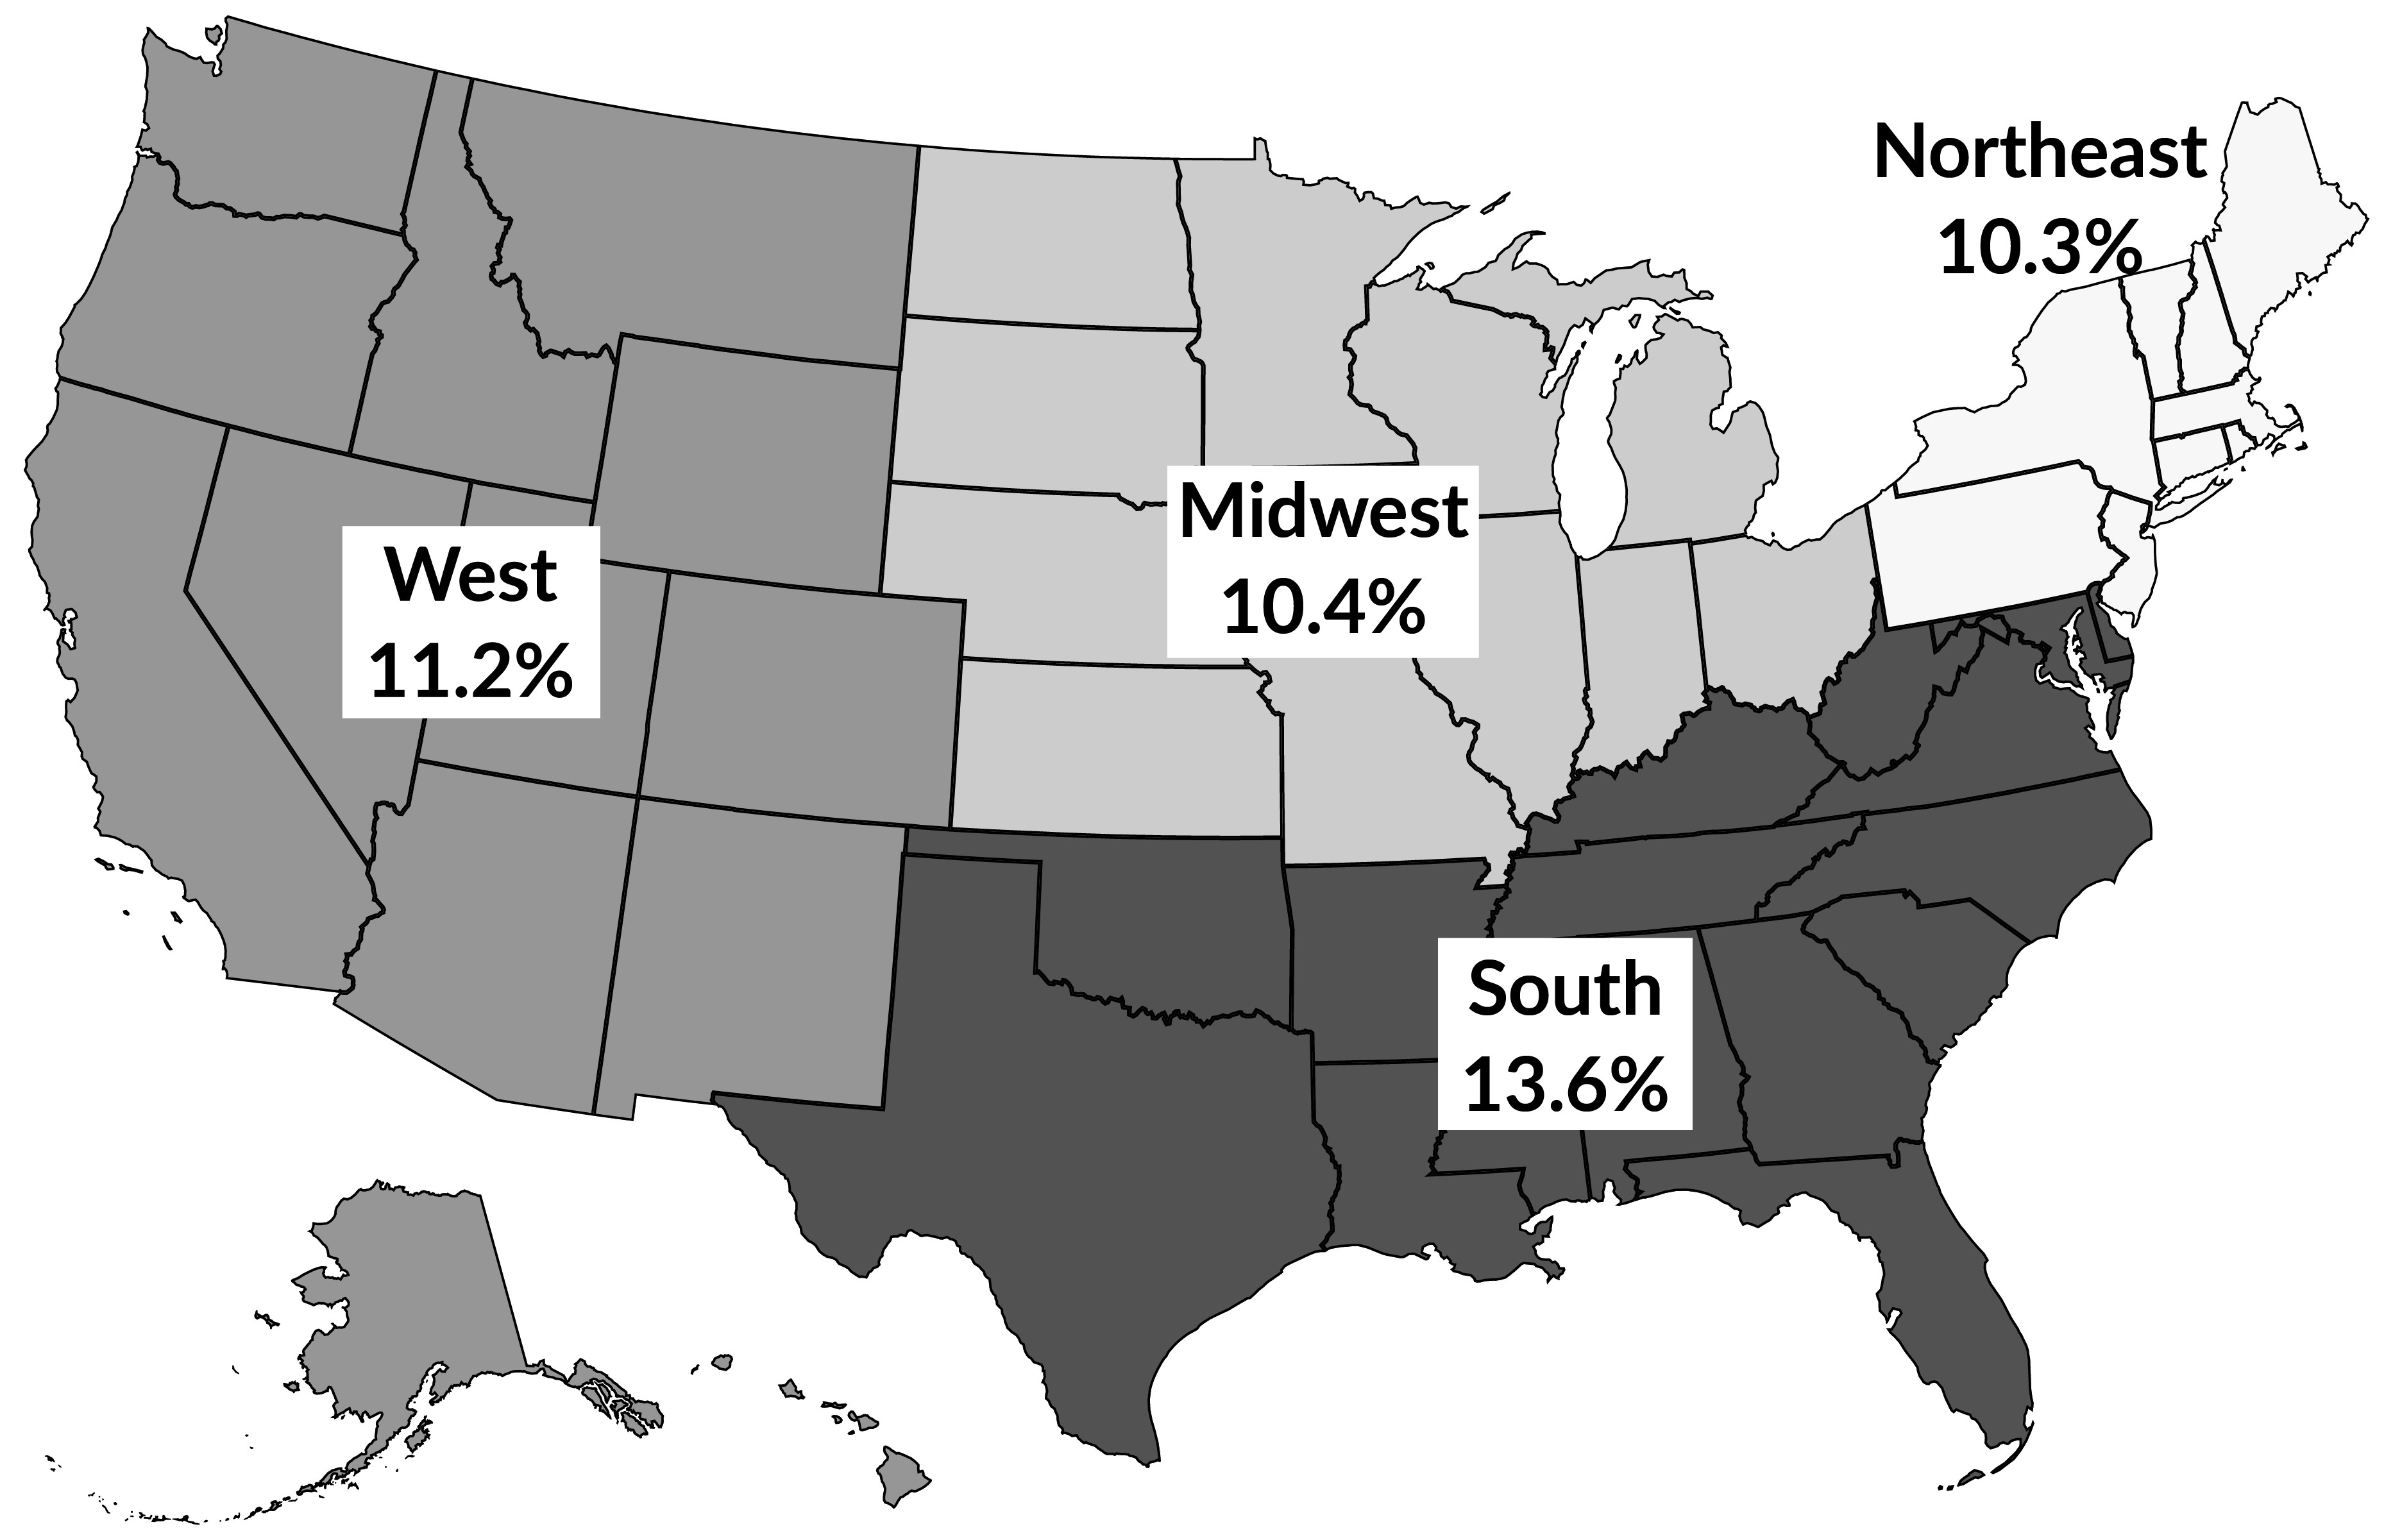
Figure 6. Poverty rates in the South were higher than the rest of the United States in 2018.
Source: U.S. Census Bureau, Income and Poverty in the United States: 2018. Table B-1, p. 50 - Work: Those who didn’t work at least one week in 2018 had the highest poverty rate of 29.7%. Among all workers with at least one week of work throughout the year, the poverty rate was just 5.1%.
U.S. Poverty Rates by Work Experience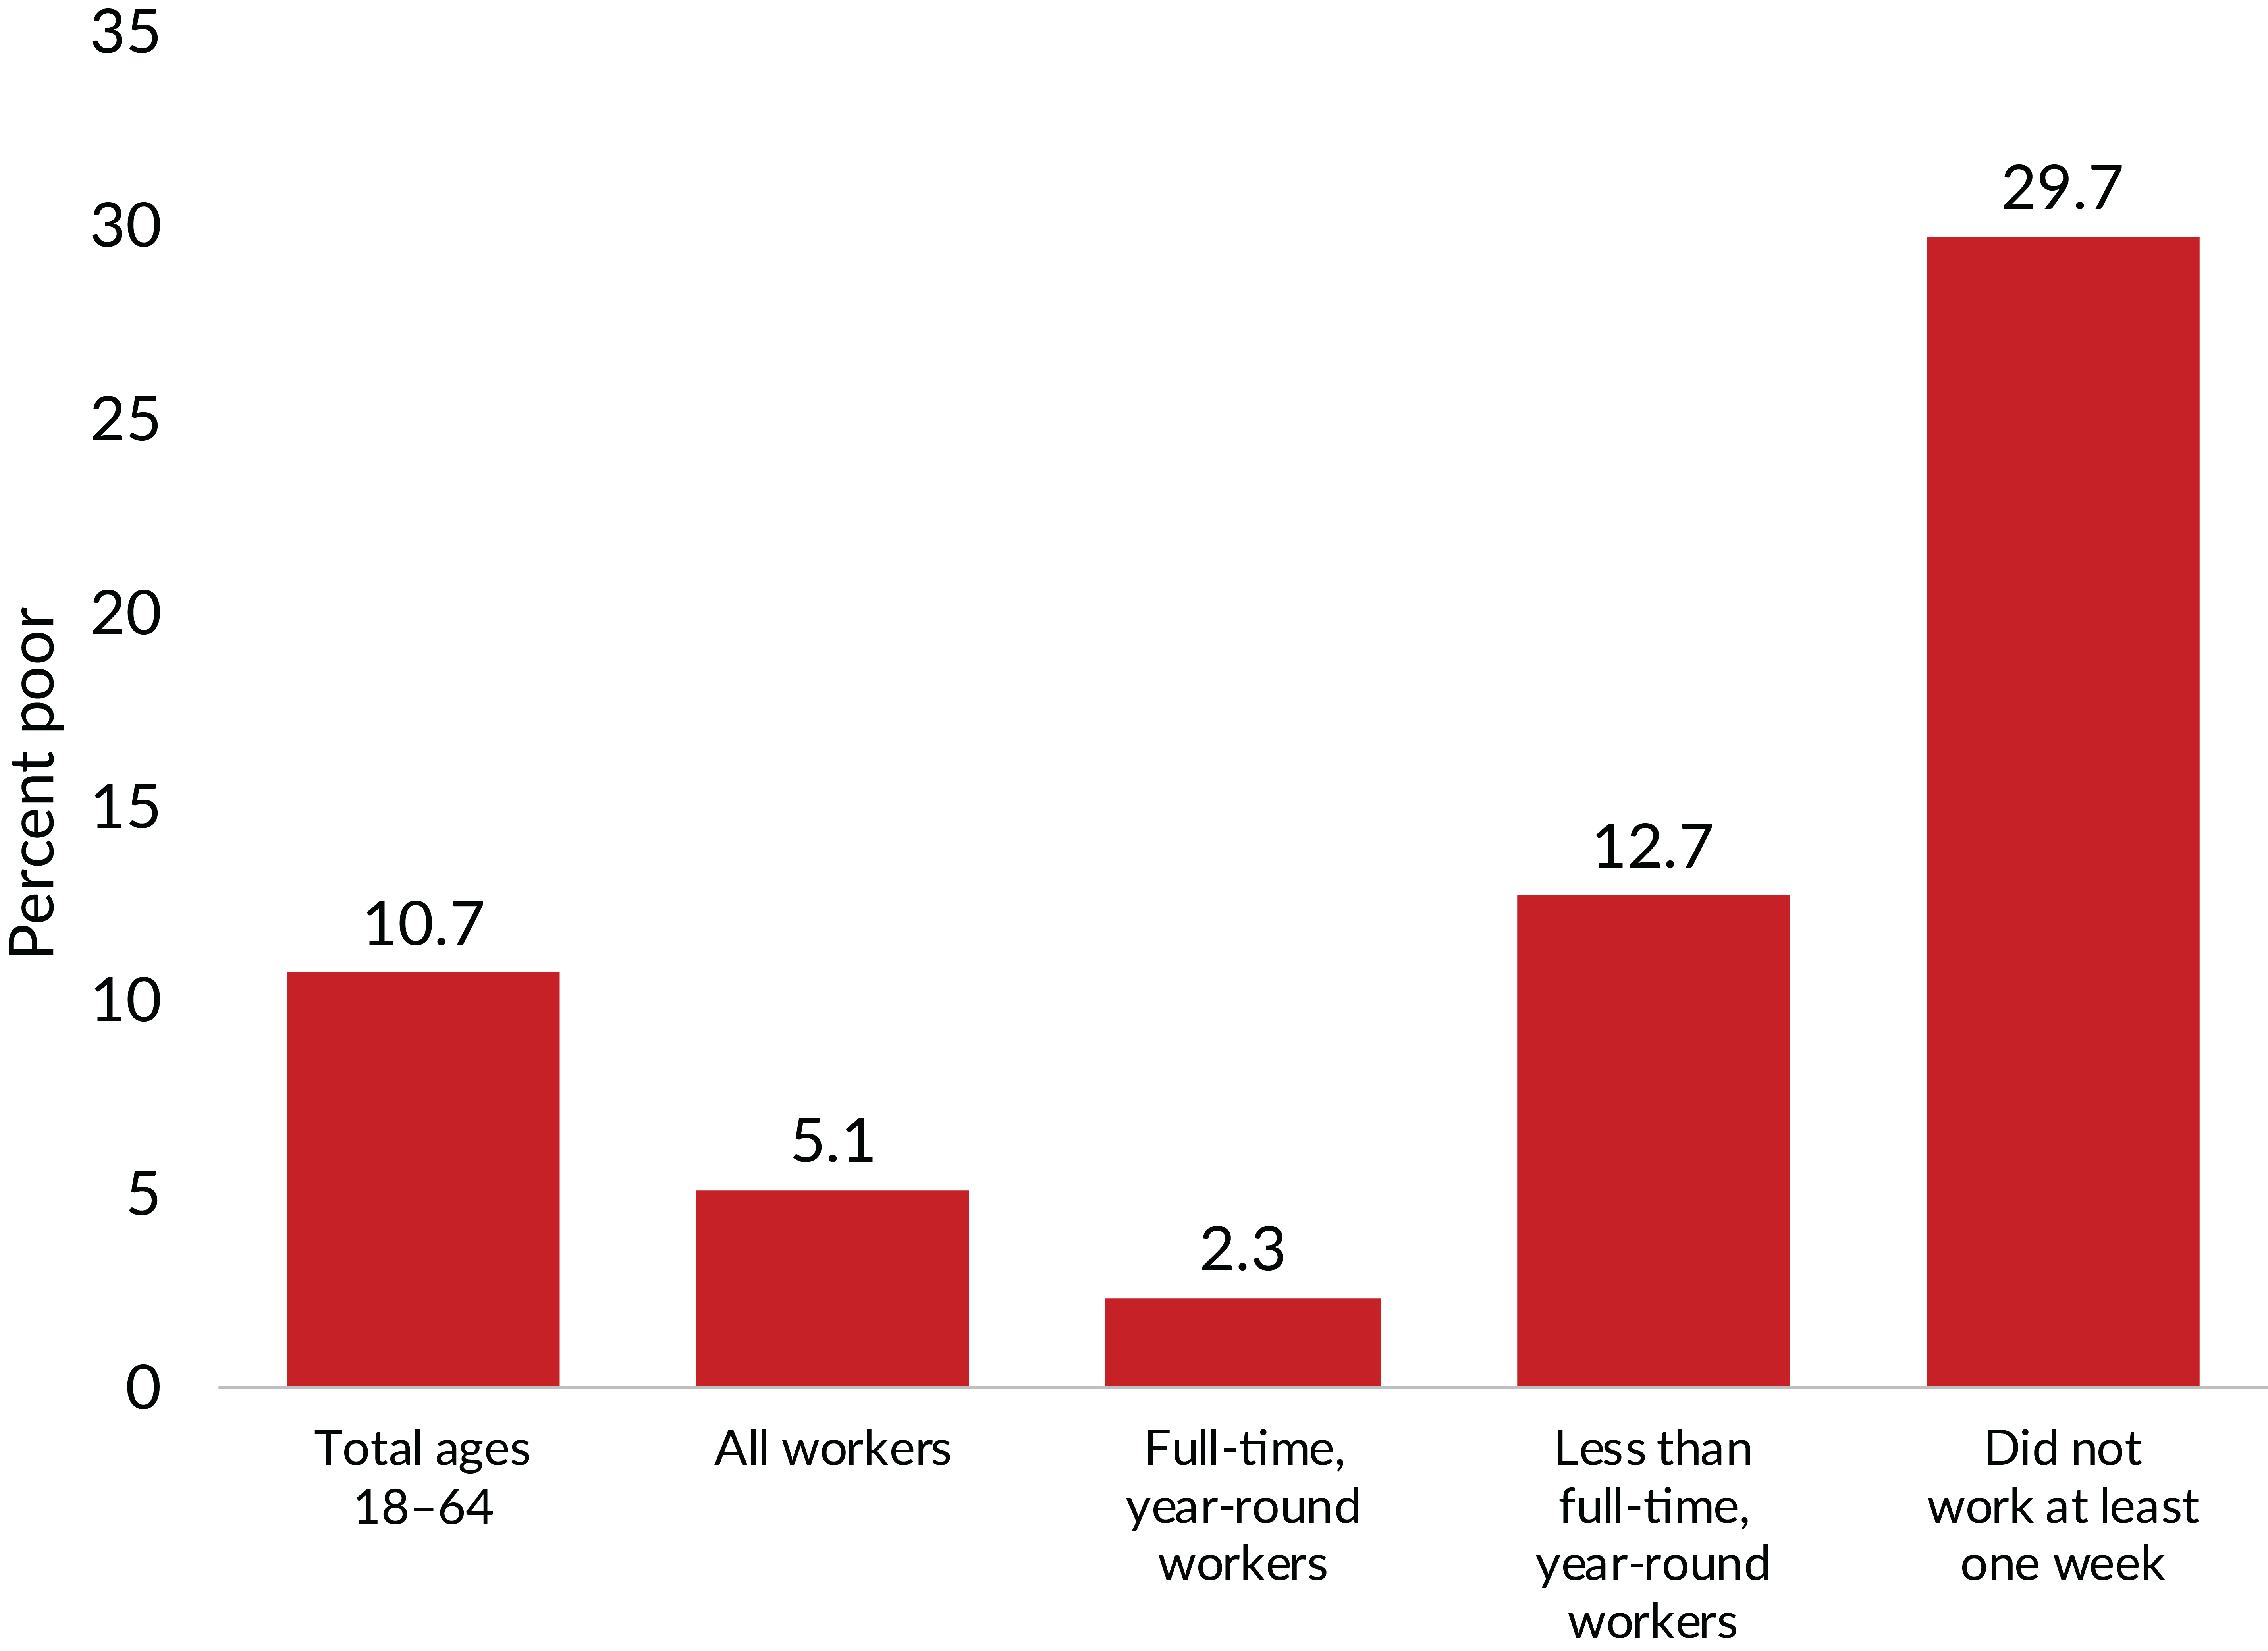
Figure 7. Poverty among workers aged 18 to 64 was lowest for those who worked full time, year round and highest for those who did not work at all in 2018.
Source: U.S. Census Bureau, Income and Poverty in the United States: 2018. Table B-1, p. 50. - Disability status: Those with a disability had a poverty rate of 25.7%; just 9.5% of those without a disability were in poverty.
U.S. Poverty Rates by Disability Status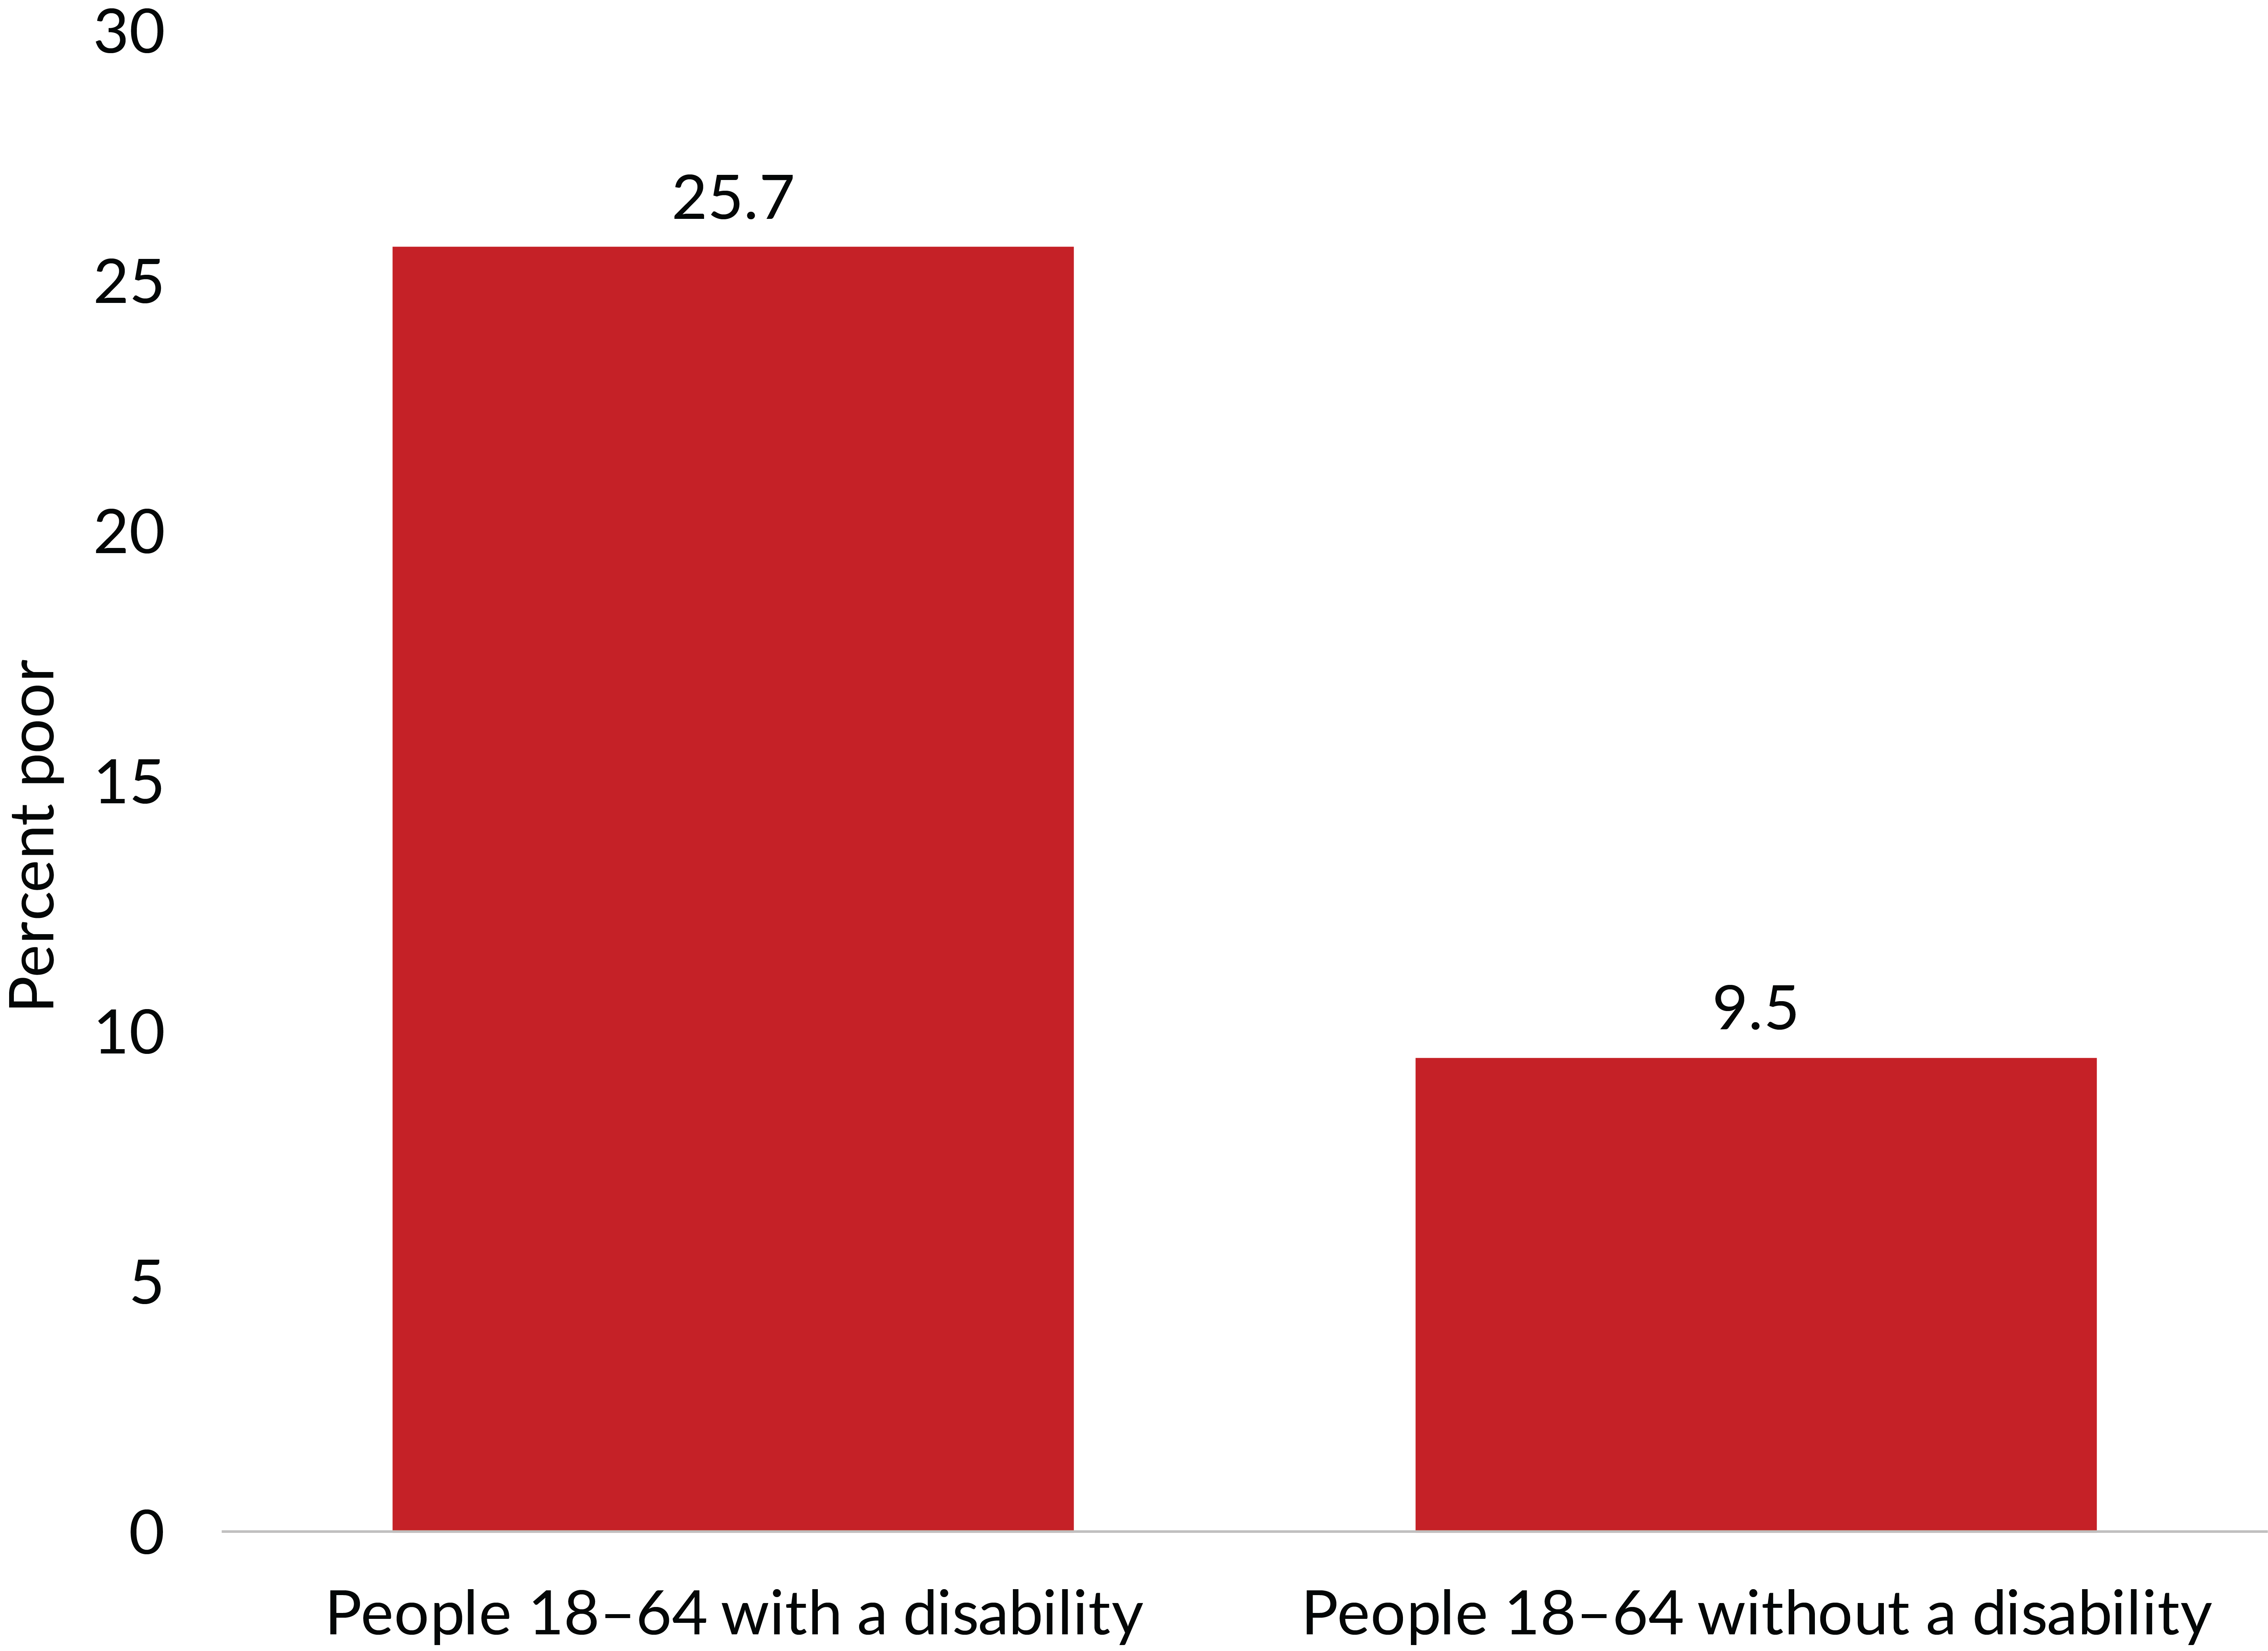
Figure 8. The poverty rate in 2018 of people between the ages of 18 and 64 with a disability was much higher than that for all people that age without a disability.
Source: U.S. Census Bureau, Income and Poverty in the United States: 2018. Table B-1, p. 50 & p. 17. - Education: Among adults aged 25 years of age and older, those without a high school diploma had the highest poverty rate of 25.9%. Those with a high school diploma had about half that rate at 12.7%. Those with a bachelor’s degree or higher had the lowest rate at 4.4%.
U.S. Poverty Rates by Educational Attainment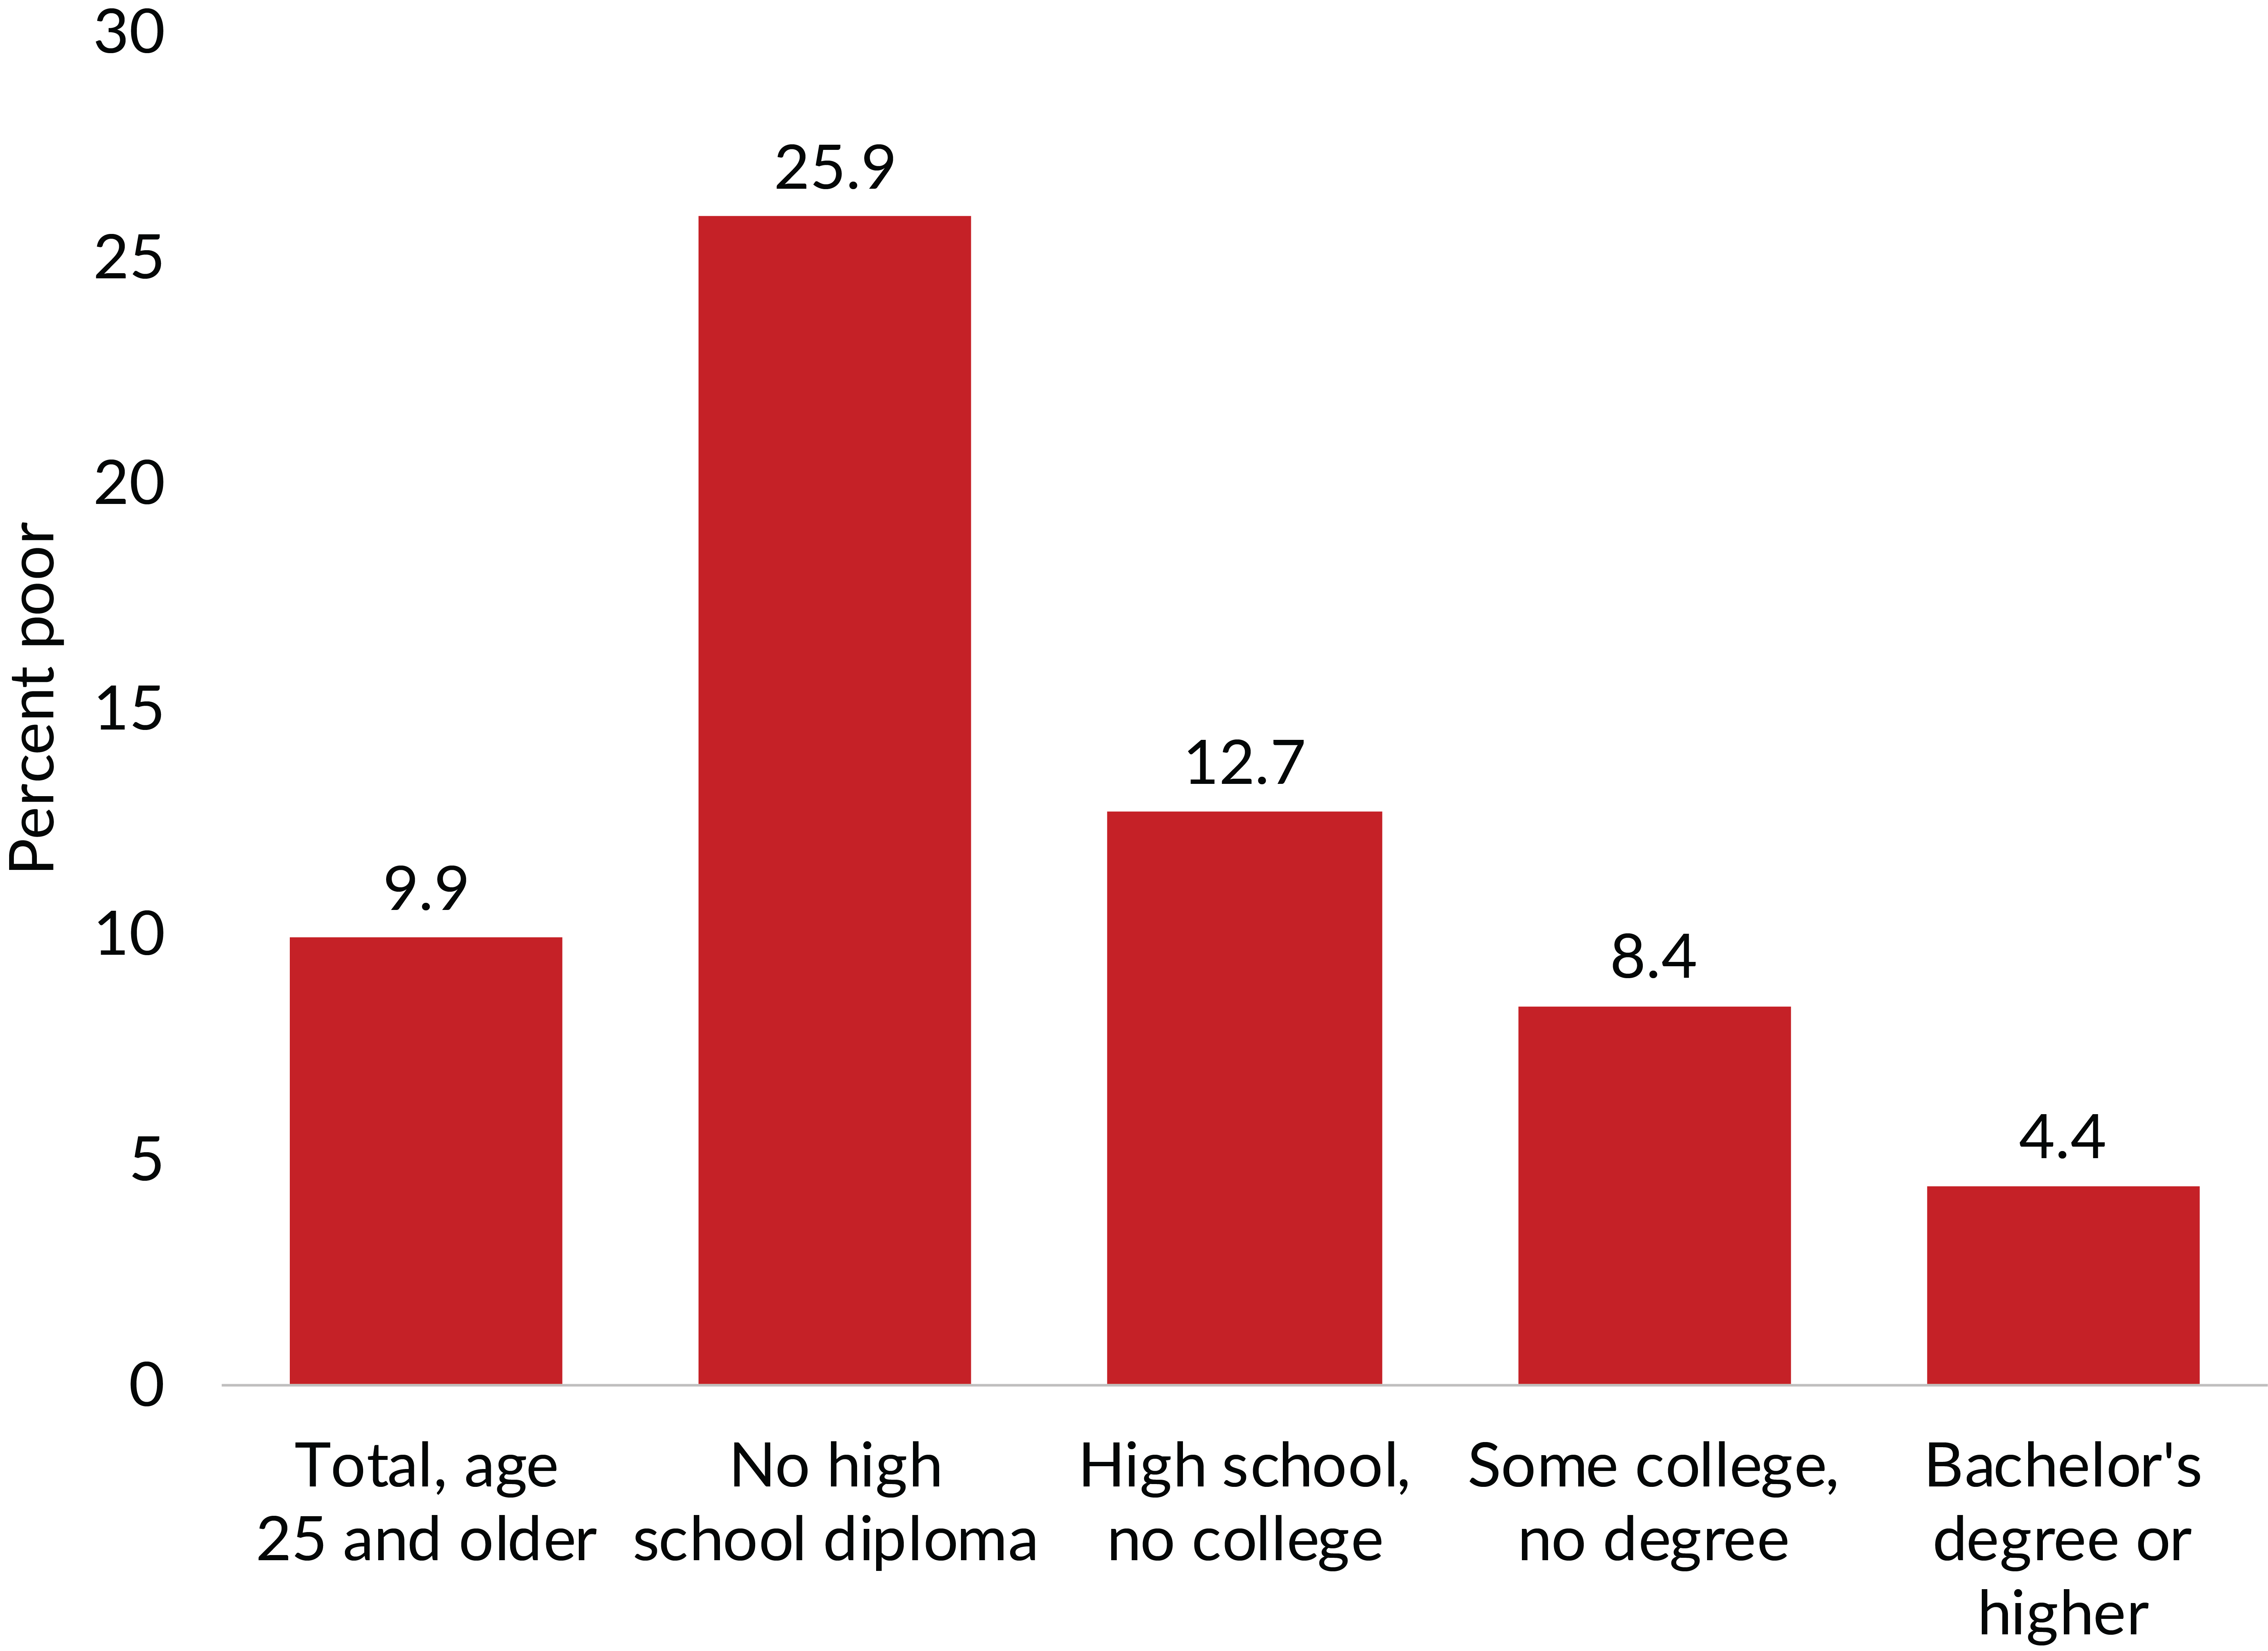
Figure 9. People with a college degree had much lower poverty rates than people with less education in 2018.
Source: U.S. Census Bureau, Income and Poverty in the United States: 2018. Table B-1.