The most recent official poverty measure estimates indicate that 12.3 percent of the population of the United States, 39.7 million people, were poor in 2017.
The estimates were released by the U.S. Census Bureau in September 2018 in the report, Income and Poverty in the United States: 2017.
This is an accordion element with a series of buttons that open and close related content panels.
U.S. Poverty Rates by State and Territory

[Source: U.S. Census Bureau]
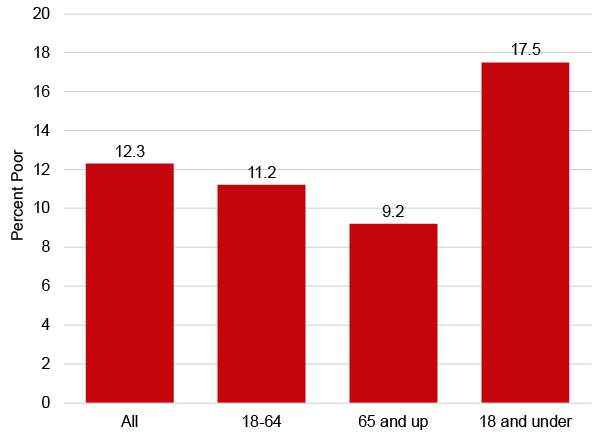
U.S. Poverty Rates by Age
Children had the highest poverty rate of the three major age groups shown in Figure 1, with 12.8 million children—17.5 percent of U.S. children—in poverty in 2017.
Figure 1. The U.S. poverty rate in 2017 was highest among children.
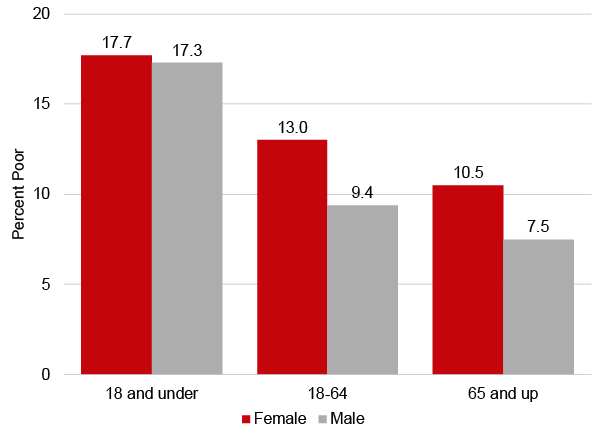
U.S. Poverty Rates by Age and Sex
In 2017, 13.6 percent of females and 11.0 percent of males in the United States were poor. Gender differences in poverty are even greater for adults in the 18 to 64 and 65+ groups, as shown in Figure 2.
Figure 2. Poverty rates differ most between the sexes for 18-64 and 65+ age group : 2017.
U.S. Poverty Rates by Race/Ethnicity
Poverty rates often differ not only by age and sex by also by race. Figure 3 shows the differences in 2017 for four major racial and ethnic groups. Among the groups, African Americans had the highest poverty rates at 21.2 percent. Hispanic poverty rates also were high, 18.3 percent.
Figure 3. Poverty rates among African Americans are more than twice those of non-Hispanic white and Asian Americans: 2017.
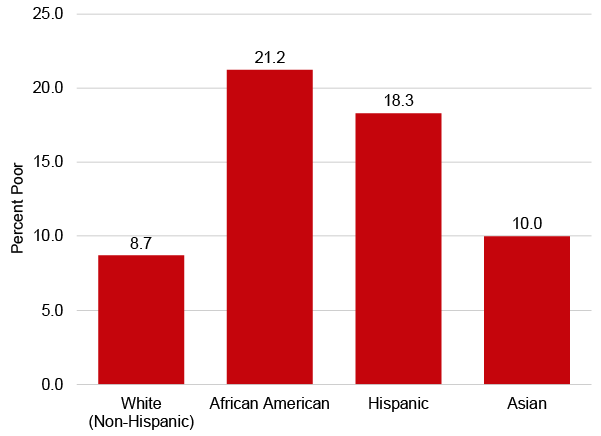
Notes: Data on poverty among persons self-identified as Asian before 2003 are not available. “Hispanic” means Latin American descent (typically Cuban, Mexican, or Puerto Rican) but carries no racial designation
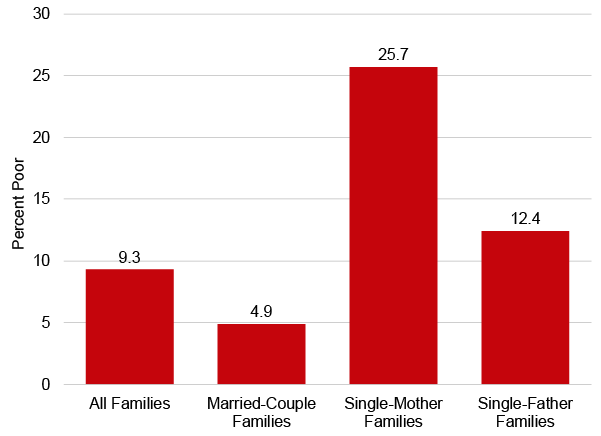
U.S. Poverty Rates by Family Type
As Figure 4 shows, in 2017 families headed by married-couple families had the lowest poverty rate at 4.9 percent and single-mother families had the highest at 25.7 percent, more than five times the rate of families headed by married couples and twice the rate of single-father families.
Figure 4. Poverty among single-parent families, especially those headed by a single mother, was highest among family types: 2017.
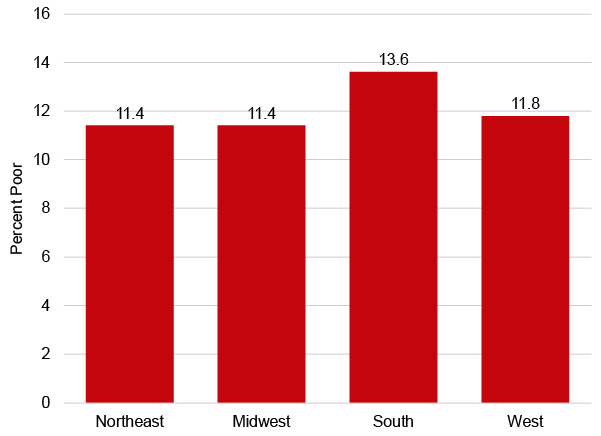
U.S. Poverty Rates by Region
Poverty rates differ by region of the United States, with the South having a higher rate than the Northeast, Midwest, and West in 2017, as shown in Figure 5.
Figure 5. Poverty rates in the South were higher than the rest of the United States: 2017.
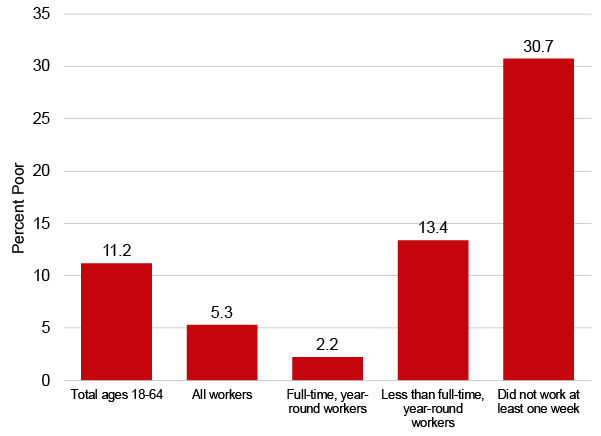
U.S. Poverty Rates by Work Experience
Comparing 2017 poverty rates among people of working age (ages 18 to 64) shows that people who didn’t work at least one week had by far the highest poverty rate at 30.7 percent and full-time workers had the lowest rate at 2.2 percent. All workers combined had a poverty rate of 5.3 percent; 2.2 percent of people working full time were poor, as were 13.4 percent of people working part-time.
Figure 6. Poverty among workers aged 18 to 64 was lowest for those who worked full-time, year round and highest for those who did not work at all: 2017.
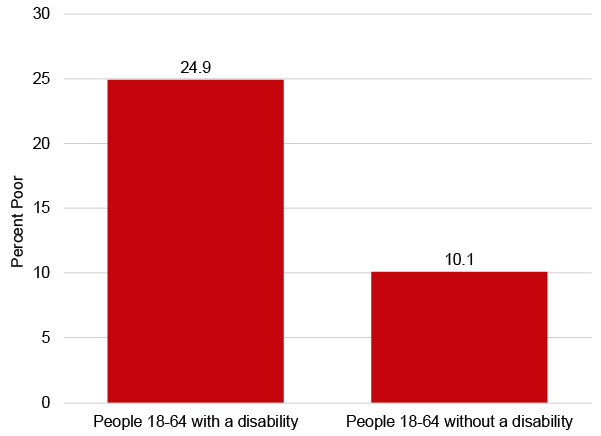
U.S. Poverty Rates by Disability Status
In 2017, among people between the ages of 18 and 64, those with a disability made up 7.6 percent of all people, compared with 16.9 percent of people aged 18 to 64 in poverty.
Figure 7. The poverty rate in 2017 of people between the ages of 18 and 64 with a disability was much higher than that for all people that age without a disability.
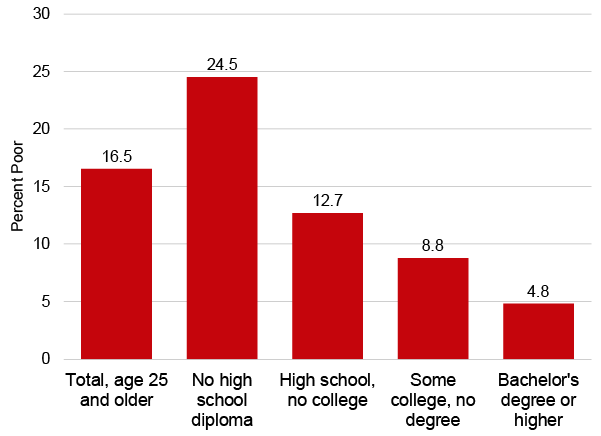
U.S. Poverty Rates by Educational Attainment
The more education a person has, the less likely he or she is to be poor. For example, people with a bachelor’s degree or higher had a poverty rate of 4.8 percent compared to people who didn’t finish high school who had a poverty rate of 24.5 percent. Figure 8 shows the 2017 poverty rates of groups by level of education.
Figure 8. People with a college degree have much lower poverty rates than people with less education: 2017.
U.S. Poverty Data Source
The official poverty estimates noted in this FAQ are drawn from the Current Population Survey Annual Social and Economic Supplement (CPS ASEC), a survey conducted every year in February, March, and April with a sample of approximately 100,000 addresses.
The Census Bureau also reports income and poverty estimates from a number of other major national household surveys and programs, but those included here are the official estimates often cited by advocates, researchers, and policymakers.
The data for all figures in this FAQ were from the U.S. Census Bureau report, Income and Poverty in the United States: 2017.