- January 2020
- Fast Focus Research/Policy Brief No. 44-2020
In September 1967, a commission on rural poverty convened by President Lyndon Johnson released its findings in The People Left Behind report. They documented a rural poverty rate of 25%, almost double the urban poverty rate.[1] Half a century after The People Left Behind’s release, IRP and the Rural Policy Research Institute held a conference to reexamine rural poverty. The research presented at the conference indicated that rural poverty declined sharply in the 1960s, but has remained fairly steady since the mid-1970s.[2] Currently, rural poverty is 3 percentage points higher than urban poverty.[3] Further, persistently high-poverty counties are disproportionally rural and continue to be geographically concentrated in Appalachia and Native American lands, the Southern “Black Belt,” the Mississippi Delta, and the Rio Grande Valley. Table 1 compares the nature of rural poverty in 1959 to rural poverty in 2016.
| Table 1. Rural poverty, 1959 vs. 2016 | |
| Unchanged | Changed |
| The persistence of high-poverty counties that are disproportionally rural and continue to be geographically concentrated in Appalachia and Native American lands, the Southern “Black Belt,” the Mississippi Delta, and the Rio Grande Valley | The rise of nonworking poverty in rural areas (prior to 2005, poor rural household heads were more likely to be working than their poor urban counterparts—this is no longer the case) |
| The persistence of higher rural than urban poverty rates (using the official poverty measure developed in the 1960s), with rural poverty rates exceeding urban poverty rates every year since 1959 | Rural nonmarital childbearing, cohabitation, and single parenthood have all rapidly increased |
| The proportion of rural men who have earned a college degree has remained at about 15% since the 1980s | Immigrants increasingly are becoming isolated in high-poverty neighborhoods in rural communities |
Work, education, and marriage are declining in rural areas.
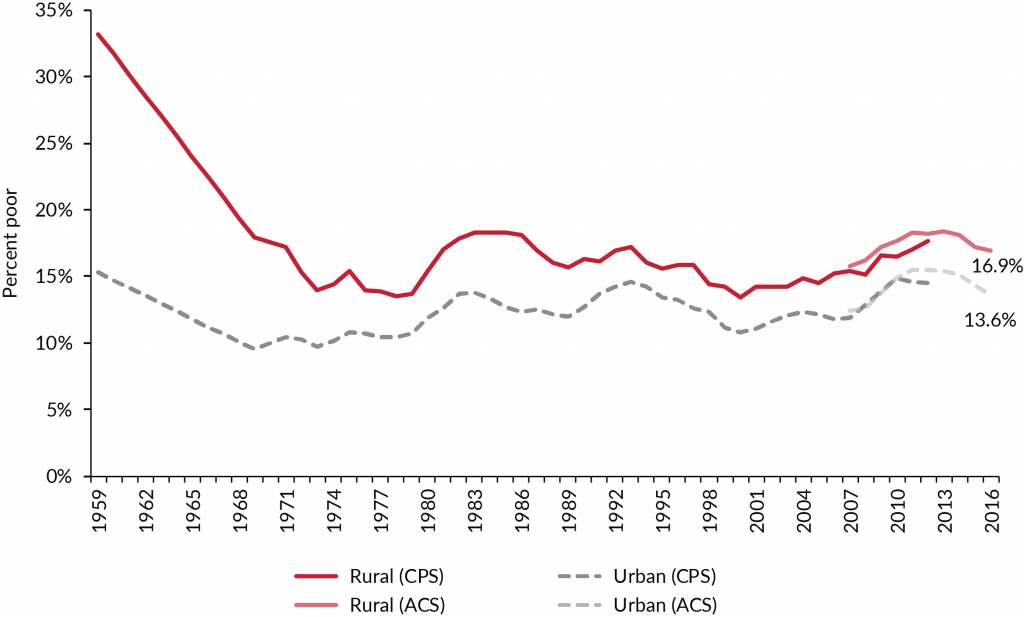
Source: USDA Economic Research Service using data from the U.S. Census Bureau’s Current Population Survey (CPS) 1960–2013 and annual American Community Survey (ACS) estimates for 2007–2016.
Notes: “Urban” counties are those designated as “metro” in the CPS and ACS data; “rural” counties are those designated as “nonmetro” in the data. The metro/nonmetro status of some counties changed in 1984, 1994, 2004, and 2014. CPS poverty status is based on family income in the past 12 months, and ACS poverty status is based on family income in the prior calendar year.
Fifty years after The People Left Behind report, work, education, and marriage remain the three main pathways out of poverty for most Americans. Unfortunately, rural residents are falling behind urbanites in these three areas.[4] Since the 1967 report’s release, income inequality has surged as incomes expanded for those at the top quintile and remained relatively flat for the rest of the population. This is especially true for skilled rural men, whose real earnings have not changed in 50 years.[5] By way of comparison, between 1979 and 2019, the top 1% of the income distribution saw their income increase by 229%.[6] In addition to stagnant rural male earnings, the rate of male employment also has fallen. Around the time of The People Left Behind’s release, there was no rural-urban gap for workers with less than a high school degree. However, by 2016, only half of rural men in this low-skill group worked at any point in the calendar year, compared to 65% of their peers in urban areas.[7] Further, the gap in college attainment between urban and rural men has increased from about 5 percentage points to about 20 percentage points between 1967 and 2016. Rates of college attainment among rural women have been steadily increasing over the decades, but they have not kept pace with increases in rates of college attendance among urban women.[8] Marriage rates in the United States overall have dropped over the past five decades, but particularly for rural families headed by parents with low levels of education.[9]
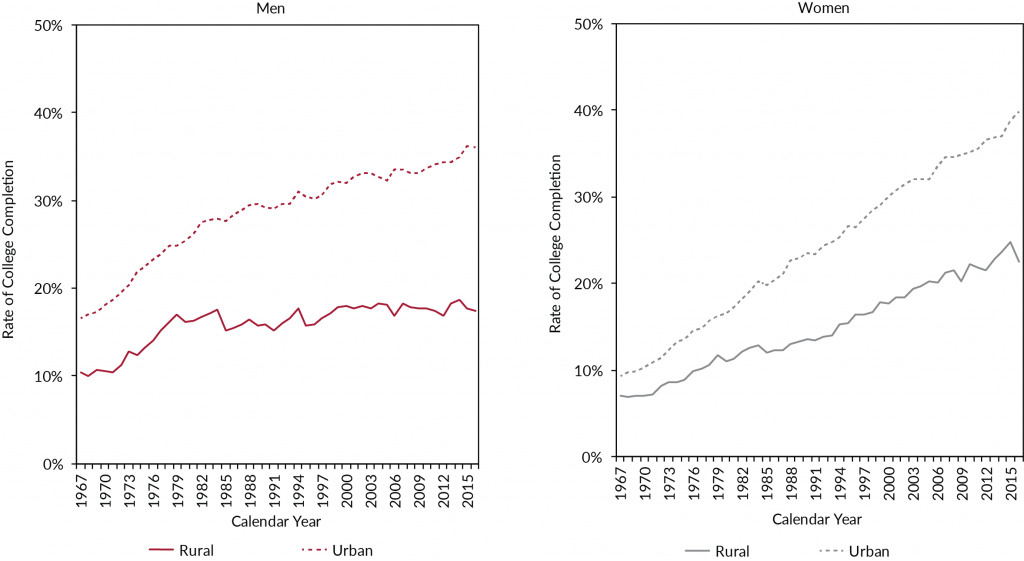
Source: The Annual Social and Economic Supplement (ASEC) of the Current Population Survey (CPS) for calendar years 1967–2016.
Race, ethnicity, and place affect poverty differently in rural vs. urban areas.
People of color are at an economic disadvantage compared to whites throughout the U.S., but this inequality is typically even greater in rural areas than in urban areas.[10] This is borne out in poverty rates for African Americans, American Indians, and Hispanics, which are much higher relative to non-Hispanic white poverty rates in rural versus urban areas.[11] Rural workers have experienced greater employment hardship compared to their urban peers, although underemployment (including individuals who would like to be employed whether or not they are currently looking for work, and those who are working part time when they would prefer to work full time) varies by race. While underemployment for Hispanic workers has grown larger for those in urban compared to rural settings, underemployment has been consistently high for rural blacks compared to both rural whites and urban blacks.[12] Persistent-poverty rates also vary by race and ethnicity. People of color are more likely than whites to be persistently poor (as measured by being poor over a two-year period) in both urban and rural settings. This inequality is higher for blacks in rural areas and for Hispanics in urban areas.[13]
Child poverty is much higher in rural vs. urban America.
Just as people of color in rural areas are more likely to be poor than their white neighbors, children in rural areas are more likely to live in poverty than a child living in the average city (Figure 3). Nationally, about one in five children lives in a family with income below the poverty threshold; more than one in four rural children lives in poverty, with even higher rates for rural children of color.[14] Not only are rural children more likely to be poor, but they also are more likely than urban children to live in areas with high rates of poverty, and therefore live in both poor families and poor places. Declines in earnings appear to be the most important factor in rising rural poverty rates, an effect that is twice as large for rural versus urban families.[15] Persistently high child poverty is disproportionately concentrated in rural counties that have low labor force participation, low rates of educational attainment, high shares of single-mother families, and high shares of service industry (low-wage) employment (Figure 4).
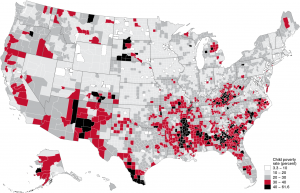
Source: Estimates by the committee from United States Population Estimates, 2016 Vintage, U.S. Census Bureau. Data as of July 1, 2015. 2015 county poverty rates from Census Small Area Income and Poverty Estimates program data.
Note: Map shows official poverty measure child poverty rates for 2015.
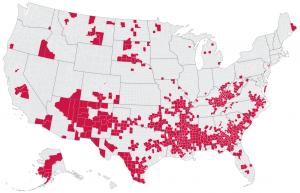
Source: Estimates by the committee from United States Population Estimates, 2016 Vintage, U.S. Census Bureau. Data as of July 1, 2015. 2015 county poverty rates from Census Small Area Income and Poverty Estimates program data.
Note: Darker shading indicates counties with official poverty measure poverty rates of 20 percent or higher in 1980, 1990, 2000, and 2008–2012.
 Policy/practice
While there is a common understanding among policymakers that poverty is still a challenge in rural America, there is no consensus on the best policy solutions.
Economic Change and the Social Safety Net
Changes to the safety net in the past 20 years that direct benefits to workers leave the most disadvantaged (rural and urban) individuals and families to receive a smaller share of benefits than before these reforms. An emphasis on work requirements for safety net programs also hits rural residents particularly hard given limited work options in these areas. See “Economic Change and the Social Safety Net: Are Rural Americans Still Behind?” slide presentation by J. P. Ziliak.
Poverty Research: The Road Forward
Many rural economies could be boosted, as some advocate, through a geographically targeted Earned Income Tax Credit (EITC), wage subsidies, and small business development. However, some researchers have raised the concern that the benefits of such policies tend to accrue to the financial elite rather than struggling families. See “Poverty Research: The Road Forward,” slide presentation by M. Partridge.
Fifty Years after The People Left Behind
Studies suggest that people-based policies such as migration subsidies that help rural workers move to places where there are more jobs are likely to suffer from low take-up. Education and training programs are slow to work and expensive to run. Instead, some experts call for public employment for low-skilled workers in need of employment, combined with more research on basic income strategies. B. Weber, “Fifty Years after The People Left Behind: The Unfinished Challenge of Reducing Rural Poverty,” Focus article.
The Rural Economy and Barriers to Work
Less controversial than public employment are proposals to expand broadband access in rural areas. Increased communications technology would enable online education, which provides a potential way to facilitate jobs training in remote rural places. Internet access would also facilitate telecommuting and perhaps allow high skill workers to still reside in more remote places and engage in some of these high skill jobs via telecommuting. “The Rural Economy and Barriers to Work in Rural America,” podcast by B. C. Thiede. Addressing poverty and low employment in rural areas is complicated by the high degree of variation in demographic characteristics of the rural population and the economic outcomes in rural communities across the country. Given this wide variation, one single intervention is unlikely to work in all places and success stories from one community can be difficult to replicate in other areas of the U.S. “The Rural Economy and Barriers to Work in Rural America,” podcast by B. C. Thiede.
[1]B. Weber and A. Tickamyer, “Rural Poverty 50 Years After ‘The People Left Behind’,” IRP webinar, September 14, 2018, available at https://youtu.be/dNWNKElbdXU.
[2]For a link to the conference video on YouTube, the agenda, and select conference materials, visit http://www.rupri.org/areas-of-work/poverty-human-services-policy/2018-rural-poverty-conference/.
[3]D. Lichter, “The Demography of Rural Poverty since The People Left Behind,” slide presentation, available at http://www.rupri.org/wp-content/uploads/Lichter_The-People-Left-Behind.pptx.
[4]J. P. Ziliak, “Economic Change and the Social Safety Net: Are Rural Americans Still Behind?” slide presentation for the “Rural Poverty: Fifty Years after the People Left Behind” conference, March 21, 2018, Washington, D.C., available at http://www.rupri.org/areas-of-work/poverty-human-services-policy/2018-rural-poverty-conference/ziliak_ruralpoverty_03-21-2018-2/; see also, J. P. Ziliak, “Economic Change and the Social Safety Net: Are Rural Americans Still Behind?” University of Kentucky Center for Poverty Research draft conference paper, available at http://www.rupri.org/areas-of-work/poverty-human-services-policy/2018-rural-poverty-conference/economic-change-and-the-social-safety-net-2/.pdf.
[5]Ziliak, “Economic Change and the Social Safety Net: Are Rural Americans Still Behind?” slide presentation.
[6]E. Gould, “Decades of Rising Economic Inequality in the U.S.: Testimony before the U.S. House of Representatives Ways and Means Committee,” Economic Policy Institute, March 27, 2019, available at https://www.epi.org/publication/decades-of-rising-economic-inequality-in-the-u-s-testimony-before-the-u-s-house-of-representatives-ways-and-means-committee/.
[7]Ziliak, “Economic Change and the Social Safety Net: Are Rural Americans Still Behind?” slide presentation.
[8]Ziliak, “Economic Change and the Social Safety Net: Are Rural Americans Still Behind?” slide presentation.
[9]Ziliak, “Economic Change and the Social Safety Net: Are Rural Americans Still Behind?” conference paper.
[10]T. Slack, B. C. Thiede, and L. Jensen, “Race, Residence, and Underemployment: 50 Years in Comparative Perspective, 1964–2017,” slide presentation for the “Rural Poverty: Fifty Years after the People Left Behind” conference, March 21, 2018, Washington, D.C., available at http://www.rupri.org/wp-content/uploads/slack-thiede-jensen_rupri-conf.pptx.
[11]Lichter, “The Demography of Rural Poverty since The People Left Behind,” slide presentation.
[12]Slack, Thiede, and Jensen, “Race, Residence, and Underemployment: 50 Years in Comparative Perspective, 1964–2017,” slide presentation.
[13]B. Weber, “Fifty Years after The People Left Behind: The Unfinished Challenge of Reducing Rural Poverty,” Focus 34(2), available at https://www.irp.wisc.edu/wp/wp-content/uploads/2018/11/Focus-34-2.pdf.
[14]D. W. Rothwell and B. C. Thiede, “Child Poverty in Rural America,” Focus 34(3), available at https://www.irp.wisc.edu/wp/wp-content/uploads/2019/02/Focus-34-3d.pdf.
Categories
Child Poverty, Children, Economic Support, Education & Training, Employment, Family & Partnering, Family Structure, Inequality & Mobility, K-12 Education, Low-Wage Work, Means-Tested Programs, Place, Postsecondary Education, Poverty Measurement, Racial/Ethnic Inequality, Spatial Mismatch, U.S. Poverty Measures, Unemployment/Nonemployment
Tags
Men, Race/Ethnicity, Rural, Single Parent, Urban, Welfare Reform/PRWORA, Women