Almost 11 percent (10.8%) of the Wisconsin population was poor in 2016, as measured by the Wisconsin Poverty Measure (WPM) developed by IRP researchers. The map below shows the counties in the state where the poverty rate was higher, lower, or similar to the statewide average.
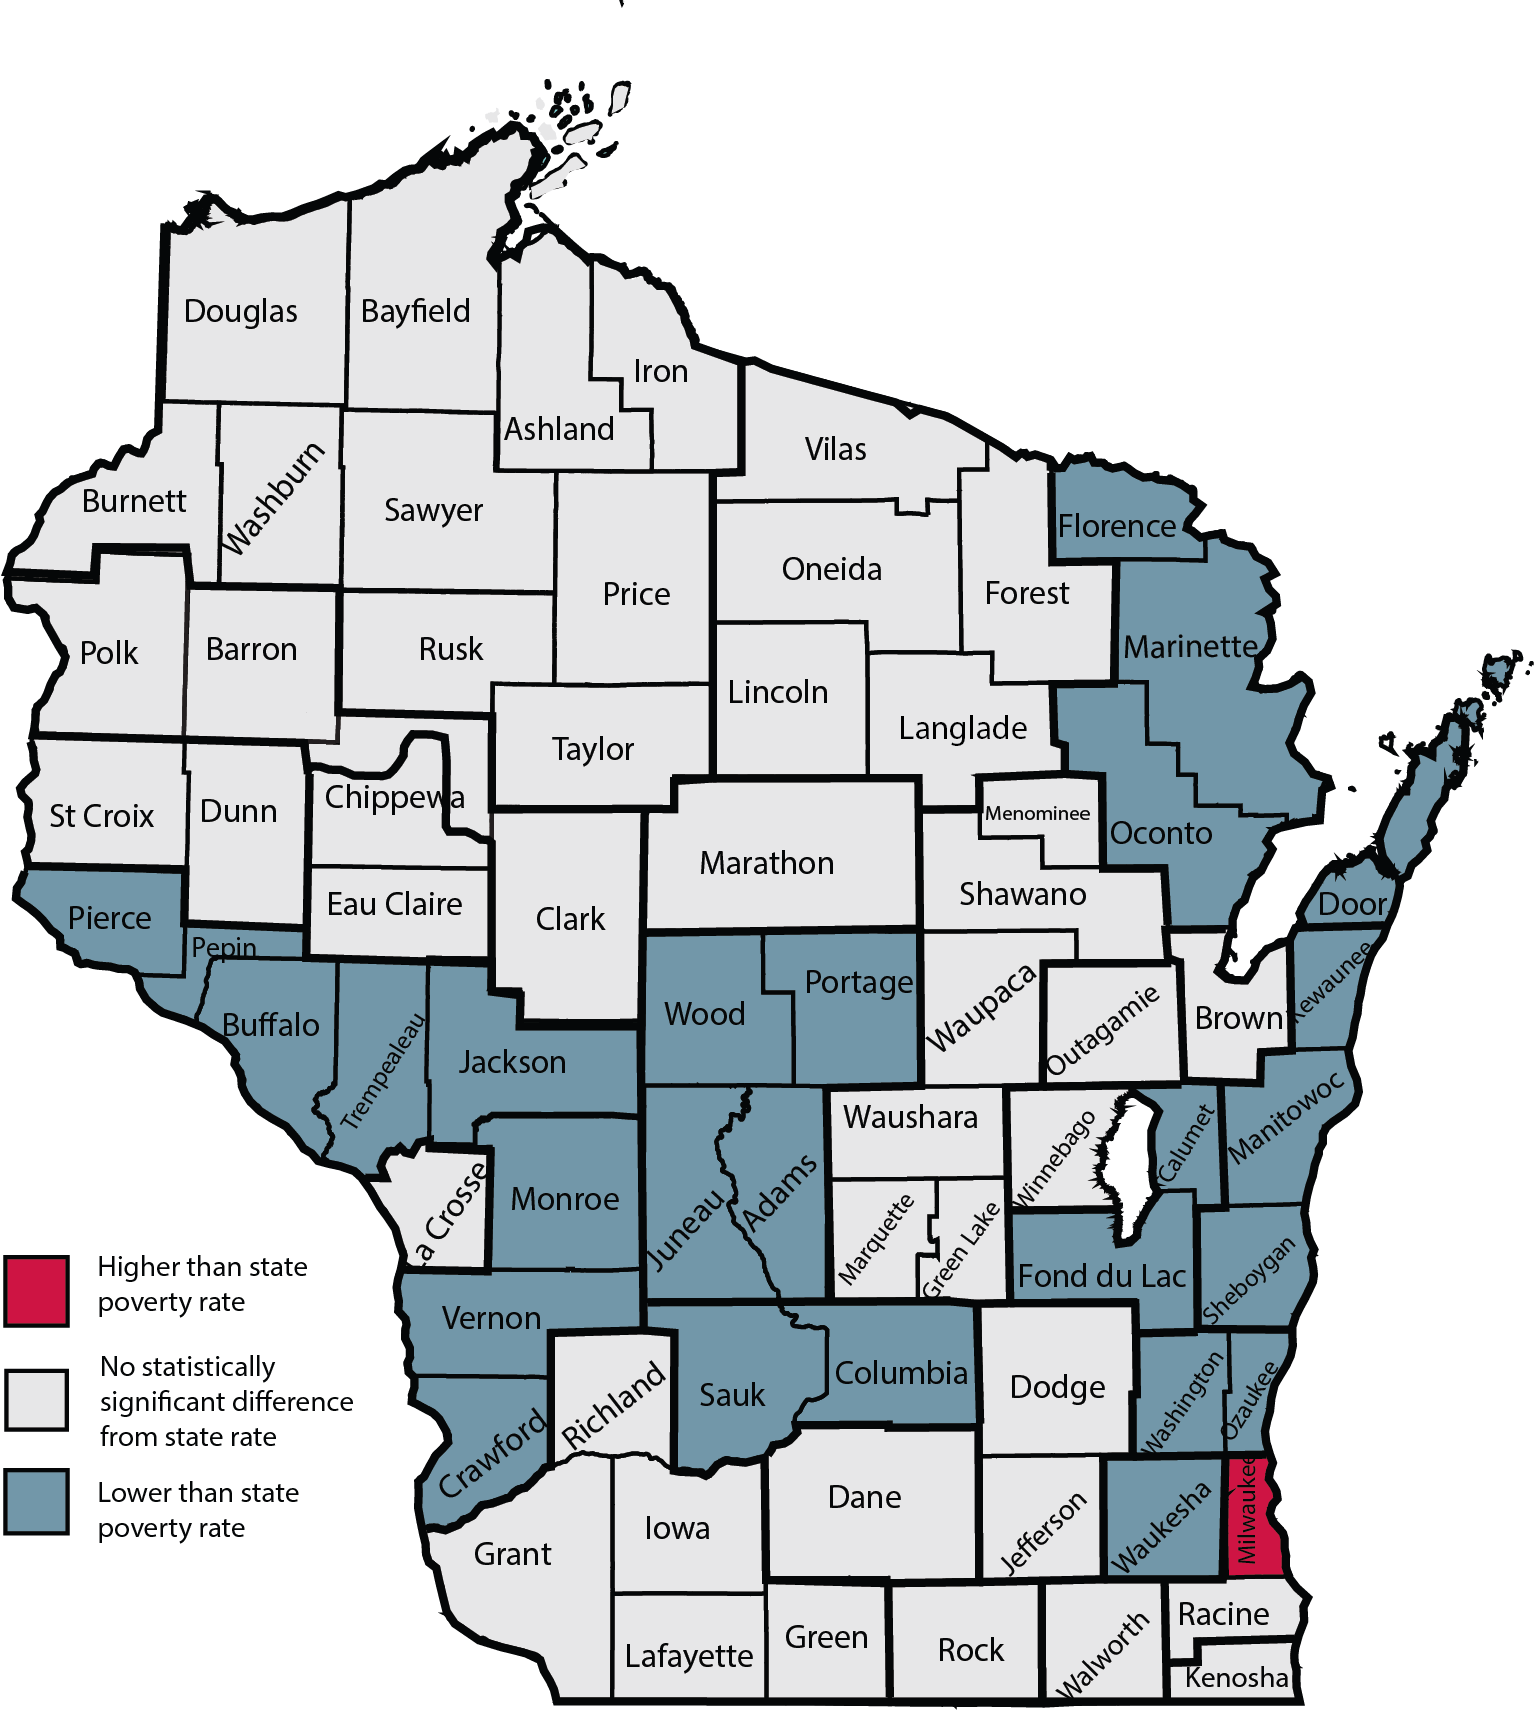
Map. 2016 WPM county-level poverty rates vary substantially in relation to the overall state rate of 10.8%.
Source: Researchers’ tabulations using 2008–2016 American Community Survey data.
This is an accordion element with a series of buttons that open and close related content panels.
Wisconsin Poverty Report (data from 2016)
The Wisconsin Poverty Measure (WPM) state poverty rate rose to 10.8 percent in 2016, a significant increase in statewide poverty from 9.7 percent in 2015, as reported in the tenth annual Wisconsin Poverty Report: Progress Against Poverty Stalls in 2016, by Timothy M. Smeeding and Katherine A. Thornton.
Released in June 2018, the Wisconsin Poverty Report charts the antipoverty effects—for the entire population overall, for children, and for the elderly—of taxes, SNAP, housing programs, and energy assistance from 2008 through 2016. The report also shows the poverty-increasing effects of work expenses such as childcare, and out-of-pocket medical costs for the same time period.
Overall Poverty in Wisconsin
Using the WPM—which counts market income, cash benefits, and noncash benefits such as FoodShare and tax credits such as the EITC—overall poverty in the state in 2016 was 10.8 percent, a significant increase from 2015.
For Wisconsinites overall, income and safety net programs offset expenses and reduced the official overall Wisconsin poverty rate by 1.0 percentage point using the Wisconsin Poverty Measure in 2016.
Child Poverty in Wisconsin
Twelve percent of children in Wisconsin were in poverty in 2016 as measured by the WPM, up from 10 percent in 2015. Researchers believe that earnings gains slowed and market-income poverty (which captures changes in employment and earnings) was flat for families with children, which account for the child poverty increase.
For Wisconsin children, income and safety net programs offset family expenses and reduced the official Wisconsin child poverty rate by almost 5 percentage points—more than a third—using the Wisconsin Poverty Measure in 2016.
Elderly Poverty in Wisconsin
Nine percent of elderly Wisconsinites were in poverty in 2016 as measured by the WPM. Social Security benefits keep many elders, who have little or no market income, out of poverty. Social Security benefits are included in both the official poverty measure and the Wisconsin Poverty Measure.
For Wisconsin elderly, out-of-pocket medical expenses likely exceeded income and safety net program assistance and increased the official Wisconsin elderly poverty rate by 1.2 percentage points using the Wisconsin Poverty Measure in 2016.
Wisconsin Poverty Measure Key Takeaways
- The Wisconsin poverty rate for the overall population as measured by the WPM increased to 10.8 percent in 2016, up from 9.7 percent in 2015.
- Child poverty under the WPM rose as well, to 12.0 percent in 2016, which was almost 5 percentage points below the official poverty measure’s rate for Wisconsin children of 16.9 percent.
- Elderly poverty also increased, from 7.8 percent to 9.0 percent in 2016 using the WPM.
- Although safety net benefits, especially Supplemental Nutrition Assistance Program or SNAP (called FoodShare in Wisconsin) and refundable tax credits such as the Earned Income Tax Credit or EITC, continued to play an important role in poverty reduction, federal and state changes to SNAP, payroll taxes, medical expenses, and work-related expenses reduced these positive effects in 2016.
- As shown in the map below, Milwaukee County (17.5% WPM poverty rate) was the only place with a rate significantly higher than the state average of 10.8 percent.
- Meanwhile, 26 of 72 total counties have poverty rates that are significantly lower than the statewide rate, including the counties of Sheboygan (4.1%, the lowest), Fond du Lac and Calumet (4.9%), Waukesha (5.4%), and three sets of smaller counties cutting across the middle of the state with rates at or below 8.6 percent.
Poverty Rates by County or Multicounty Area
A significant strength of the WPM is its ability to portray poverty across regions within the state. In 2016, researchers found overall statewide poverty rates hide substantial variations in poverty across Wisconsin regions, as shown in Table 1.
Researchers’ categorization of substate areas includes 13 large counties and 15 multicounty areas that encompass the remaining areas of the state. While some of the multicounty areas comprise only two counties (e.g., Sauk and Columbia), others require as many as 10 of the more rural counties to reach a sufficient sample size to obtain reliable estimates.
| Table 1. Wisconsin WPM poverty rates by county or multicounty area and difference from state average, 2018 | ||
| Wisconsin Poverty Measure (%) | Difference from State Average | |
| County | ||
| Milwaukee | 17.5 | Higher |
| Dane (Madison) | 10.8 | NS |
| Waukesha | 5.4 | Lower |
| Brown (Green Bay) | 10.0 | NS |
| Racine | 12.2 | Higher |
| Kenosha | 13.3 | NS |
| Rock (Janesville) | 11.4 | NS |
| Marathon (Wausau) | 11.7 | NS |
| Sheboygan | 4.1 | Lower |
| La Crosse | 13.8 | NS |
| Outagamie (Appleton) | 7.6 | NS |
| Winnebago (Oshkosh) | 10.9 | NS |
| Walworth (Whitewater) | 9.6 | NS |
| Multi-County Area | ||
| Washington & Ozaukee (West Bend) | 6.5 | Lower |
| Sauk & Columbia (Baraboo) | 7.6 | Lower |
| Dodge & Jefferson | 9.7 | NS |
| Manitowoc & Kewaunee | 6.8 | Lower |
| Fond du Lac & Calumet | 4.9 | Lower |
| St. Croix & Dunn | 14.0 | NS |
| Eau Claire & Chippewa (South) | 11.1 | NS |
| Barron, Polk, Clark & Chippewa (North) | 11.2 | NS |
| Marinette, Oconto, Door & Florence | 7.5 | Lower |
| Central Sands—Wood, Portage, Juneau & Adams | 8.5 | Lower |
| Oneida, Lincoln, Vilas, Langlade & Forest | 9.8 | NS |
| Grant, Green, Iowa, Richland & Lafayette | 10.8 | NS |
| East Central Wisconsin | 11.9 | NS |
| West Central Wisconsin—Northern Mississippi Region | 8.6 | Lower |
| Northwest Wisconsin | 10.8 | NS |
| State | 10.8 | |
| Source: IRP tabulations of 2016 American Community Survey data. Note: NS = Not statistically significant. In this analysis, each region’s difference from the state average was assessed as not statistically significant if the 90% confidence intervals for each region’s statistics and the state’s overall statistics overlap. |
||