- Timothy M. Smeeding and Katherine A. Thornton
- October 2020
- WIPOV12-2020
- Link to WI-PovertyReport2020 (PDF)
- Link to WI-PovertyReport2020-Summary (PDF)
The Wisconsin Poverty Measure, now in its twelfth year, was developed by researchers at the Institute for Research on Poverty at the University of Wisconsin–Madison to show whether families in the state have the necessary income to meet their basic needs. The report employs three different measures for estimating poverty in Wisconsin from 2008 to 2018. The three measures are: the market income poverty measure (MIP), which is based on market (private) income only; the Census Bureau’s official poverty measure (OPM), which adds in the value of public cash benefits; and the Wisconsin Poverty Measure (WPM), which takes into account not only cash benefits but also noncash benefits and taxes. The report aims to inform policy with up-to-date and place-specific data that go beyond the official poverty statistics for Wisconsin.
Key Points from this Year’s Report
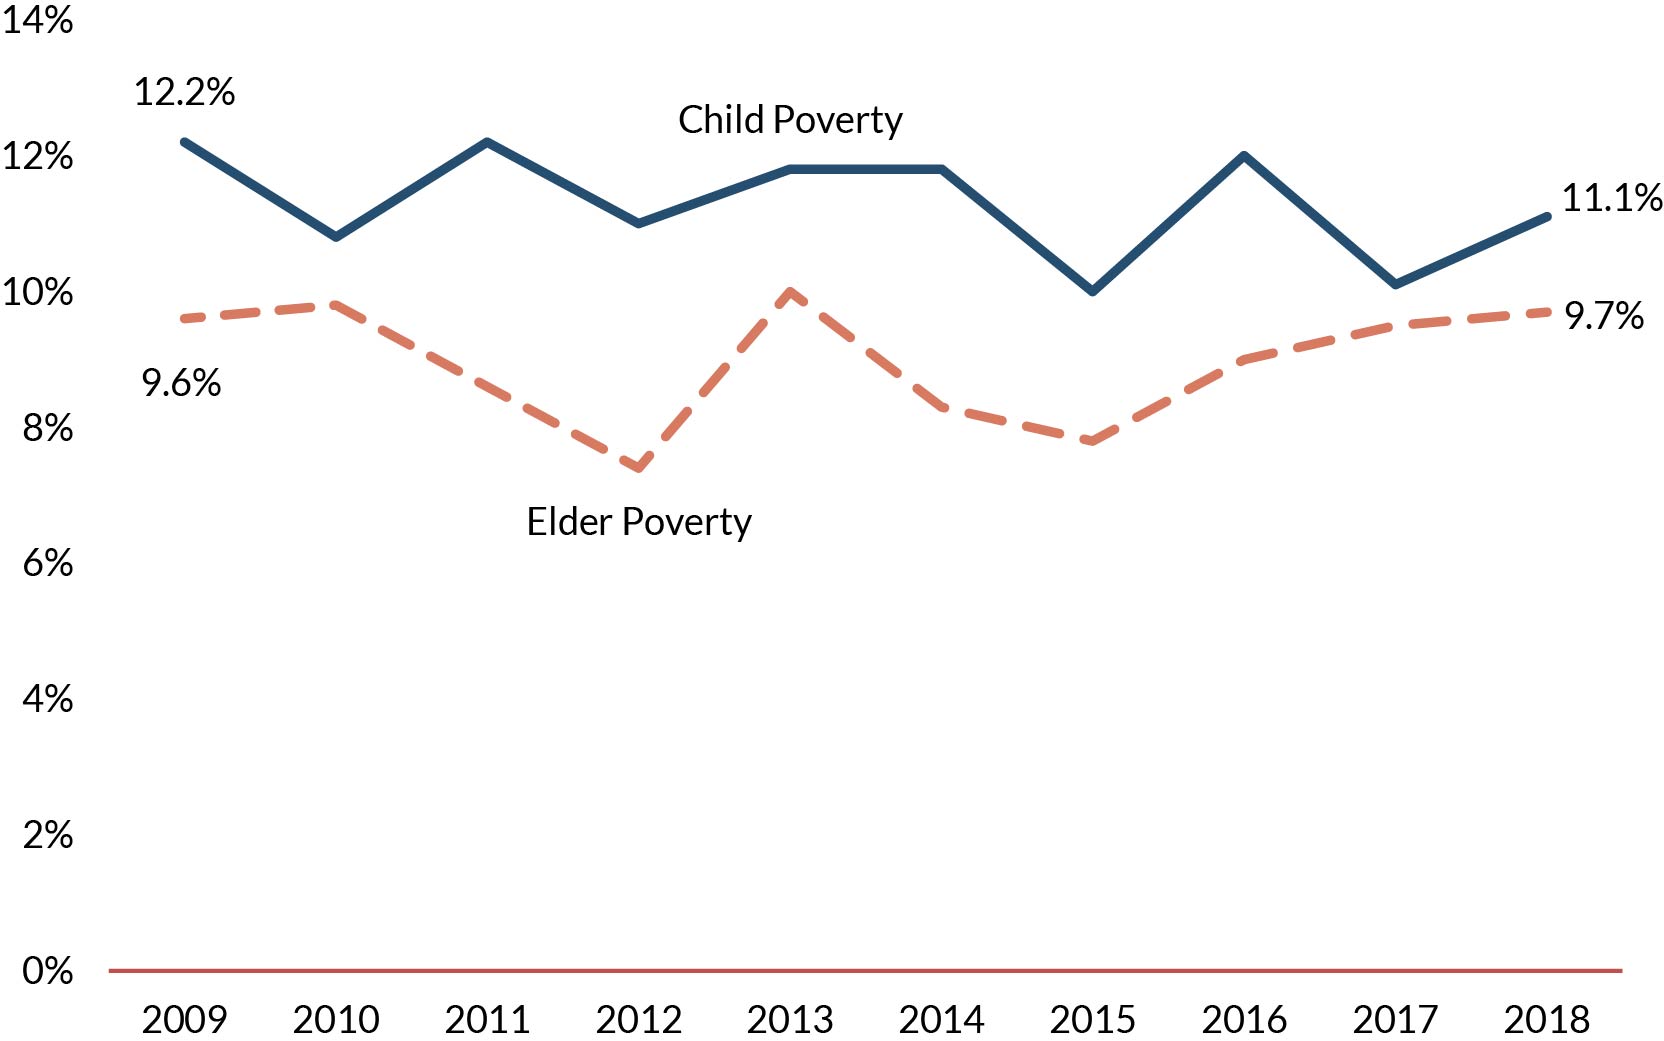
Poverty increased across the board in 2018
Poverty increased for both children and elders in 2018. The poverty rate for families with children ticked back up from about 10% in 2017 to just over 11% in 2018 despite the relatively strong economy in 2018. The weight of work expenses—particularly child care—paired with rising rents and payroll taxes, offset gains from a growing labor market.
Older Wisconsin residents (aged 65+) saw their poverty rates continue a steady increase since 2015, to 9.7% in 2018. The recent increases in elder poverty may in part be due to growing costs of living, particularly for out-of-pocket medical expenses, which can be a particular burden for those later in life.
How Is Poverty Measured?
This document reflects the Wisconsin Poverty Measure (WPM), developed by researchers at the Institute for Research on Poverty at the University of Wisconsin–Madison. The measure identifies whether families have the necessary income to meet their basic needs. It counts families’ market income and public cash benefits, in addition to noncash benefits (such as FoodShare) and tax credits. It also deducts necessary expenses such as child care and medical expenditures and adjusts for geographic differences in prices.
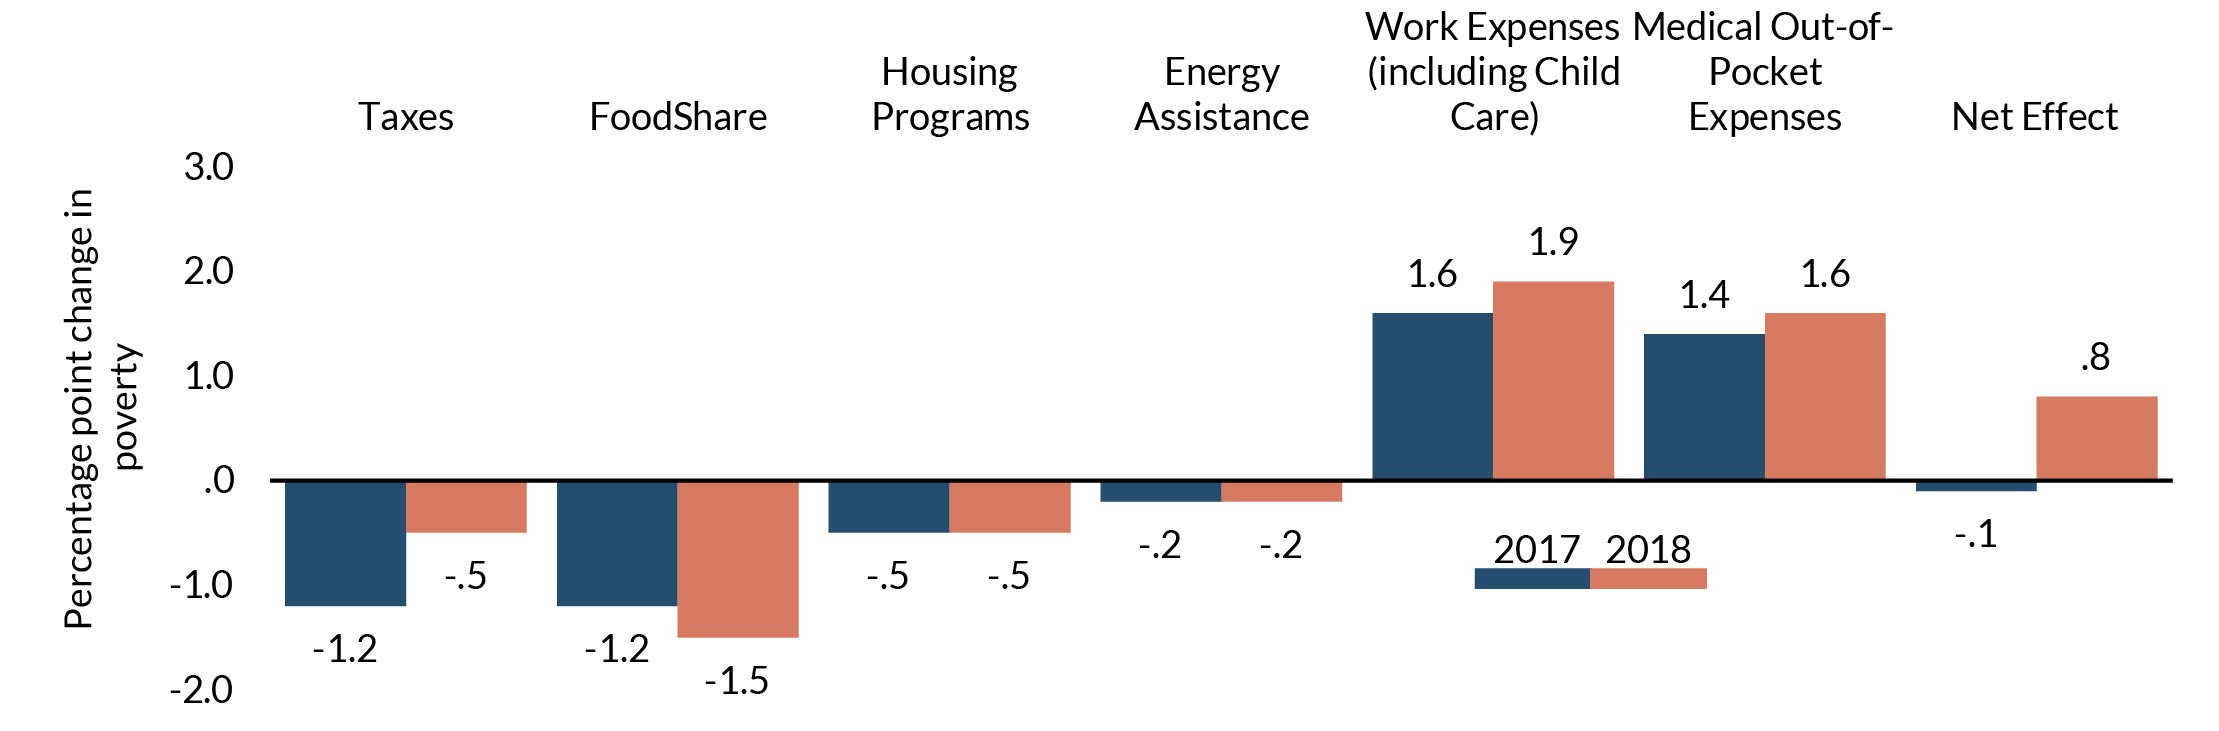
Non-market effects on income increased poverty in 2018
The rising costs of medical care and child care, combined with a greater tax burden on low-income workers, pushed people into poverty in 2018. Out-of-pocket expenses, particularly for child care and medical care, rose between 2017 and 2018. In addition, the increasing burden of payroll taxes and the shrinking effect of the Earned Income Tax Credit limited the tax system’s ability to reduce poverty, a notable difference from 2017. At the same time, there was a small increase in FoodShare’s antipoverty impact from 2017 to 2018. Taken together, non-market factors on household income pushed more people into poverty than lifted them out for the first time since the Great Recession.
Poverty is highest in the Milwaukee and Racine counties
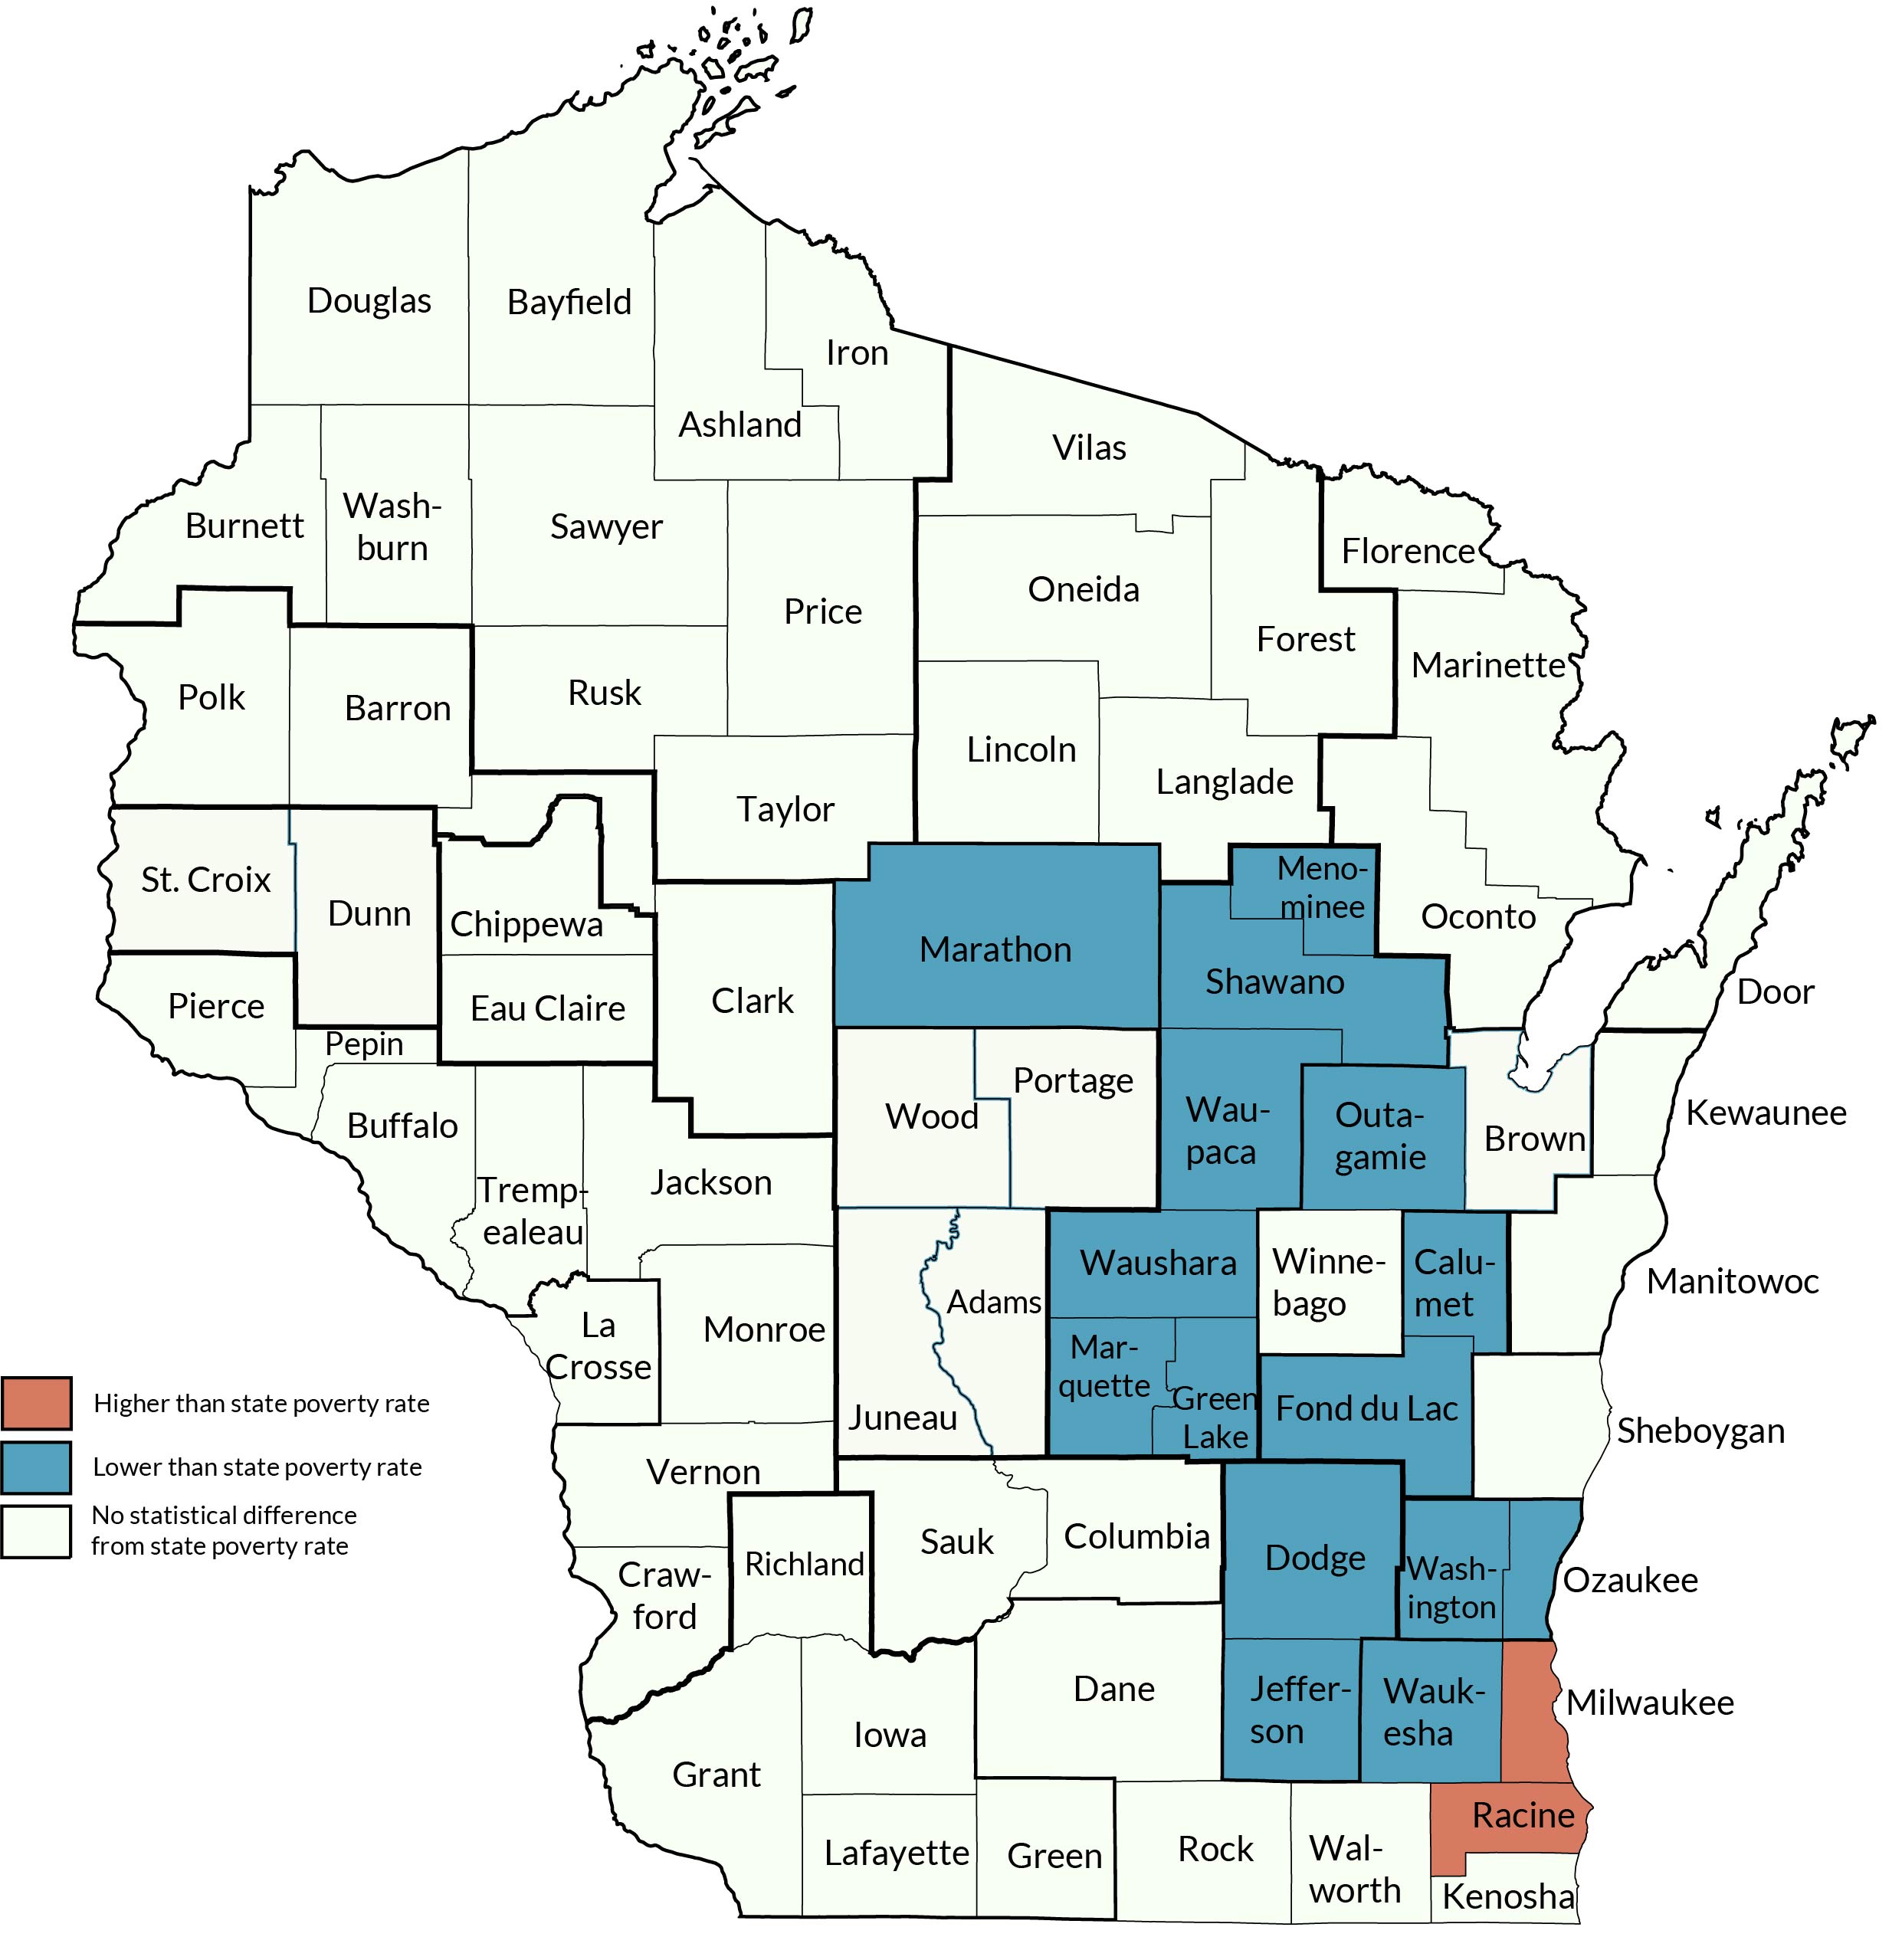
To understand how poverty varies across Wisconsin, the report estimates poverty for counties and substate areas. Poverty was lowest in Washington and Ozaukee Counties at 4%, with the next lowest in Outagamie County at 6%. Racine and Milwaukee Counties both saw poverty rates above the state average. Milwaukee County’s poverty rate was 16.2% in 2018, down from 17.2% in 2017. In Racine County, our poverty estimate increased substantially, from 10.3% in 2017 to 14.2% in 2018. All other areas of the state had lower poverty rates or similar to the statewide average.
A stagnant minimum wage can’t keep up with rising costs of living
Too many working families in Wisconsin languish with poverty incomes. Low wages, limited access to the safety net (especially FoodShare and Medicaid), out-of-reach child care, and increasing taxes keep families from climbing out of poverty. Despite the longest period of economic growth on record, both child and elder poverty rates rose in 2018.
Increasing the minimum wage, strengthening key income and work supports (such as child care and Medicaid), and lowering tax burdens will help Wisconsin families leave poverty. Without these, the best long-term solution to poverty for working-age adults—a secure, well-paying job—will remain out of reach.
Categories
Poverty Measurement, State & Local Measures, WI Administrative Data Core, Wisconsin Poverty Reports