This annual lecture honors the life’s work of Robert J. Lampman, a professor of economics at UW–Madison for over 30 years and IRP’s founder and guiding spirit. The lecture features eminent poverty scholars discussing their research on the topics to which Lampman devoted his intellectual career: poverty, the distribution of income and wealth, and related public policy. The lecture is held on the UW-Madison campus and is open to the public. Videos and transcripts of past lectures, as well as the opportunity to donate to the Robert J. Lampman Memorial Fund are available on this website.
2026 Robert J. Lampman Memorial Lecture
April 16, 2026
The Skill Divide in the Gig Economy
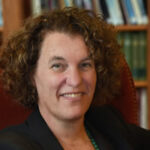
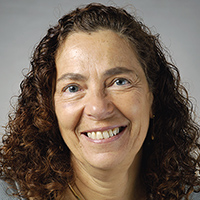
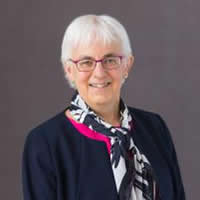
Katharine G. Abraham
Distinguished University Professor of Economics
University of Maryland
Growing numbers of U.S. workers are employed as independent contractors rather than wage-and-salary employees. A sizable share of the workforce pieces together multiple streams of income rather than relying on earnings from a single job. For some, these arrangements offer real benefits and are personally satisfying. For others, however, the picture is bleaker. The lecture will present new evidence on the skill divide in today’s gig economy and consider its implications for workers and public policy.
Recording of the Lecture
Robert J. Lampman Memorial Fund
A memorial has been established by the Lampman family with the help of the University of Wisconsin Foundation to support this lecture series. The lecture series, organized by IRP in cooperation with the UW–Madison Department of Economics, offers a special opportunity to maintain and nurture interest in poverty research among the academic community and members of the public. Contributions to the fund are welcome, to ensure continuation of the lectures. The Institute can accept donations through a secure online giving form provided by the UW Foundation. The form will be pre-filled with information necessary to direct your gift to the Robert J. Lampman Memorial Fund. For more information on how to contribute to IRP please see Make a Gift.