- Timothy M. Smeeding and Katherine A. Thornton
- June 2019
- WIPOV11-2019
- Link to WI-PovertyReport2019 (PDF)
- Link to WI-PovertyReport2019-Summary (PDF)
The Wisconsin Poverty Measure, now in its eleventh year, was developed by researchers at the Institute for Research on Poverty at the University of Wisconsin–Madison to show whether families in the state have the necessary income to meet their basic needs. The report employs three different measures for estimating poverty in Wisconsin from 2008 to 2017. The three measures are: the market income poverty measure (MIP), which is based on market (private) income only; the Census Bureau’s official poverty measure (OPM), which adds in the value of public cash benefits; and the Wisconsin Poverty Measure (WPM), which takes into account not only cash benefits but also noncash benefits and taxes. The report aims to inform policy with up-to-date and place-specific data that go beyond the official poverty statistics for Wisconsin.
Key Points From This Year’s Report
Poverty in Wisconsin fell from 10.8% in 2016 to 10.2% in 2017.
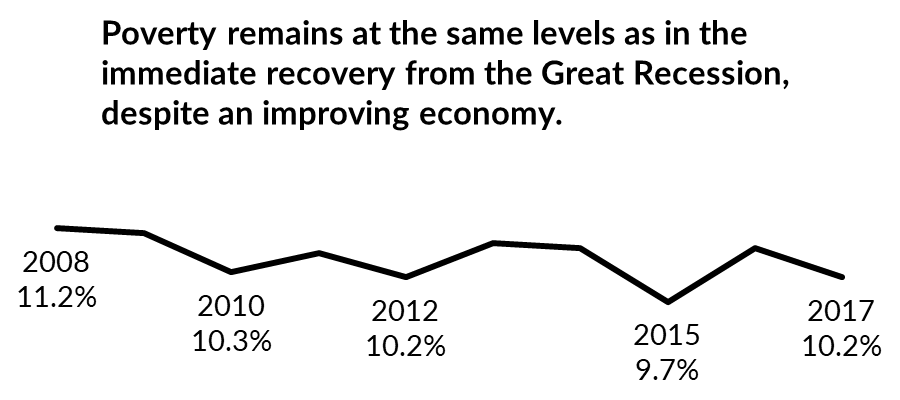
The state’s growing economy has had little effect on the poverty rate as rising costs of living, especially in the areas of childcare and medical care, offset gains in earnings and employment. This left Wisconsin’s poverty rate in 2017 about the same as it was in 2010.
Child poverty fell while poverty for elders rose in 2017. Child poverty fell from 12.0% in 2016 to 10.1%, and poverty among elders rose from 9.0% to 9.5%, continuing a climb begun in 2015.
Treading Water In 2017: Poverty Declined For Children But Increased For Elders
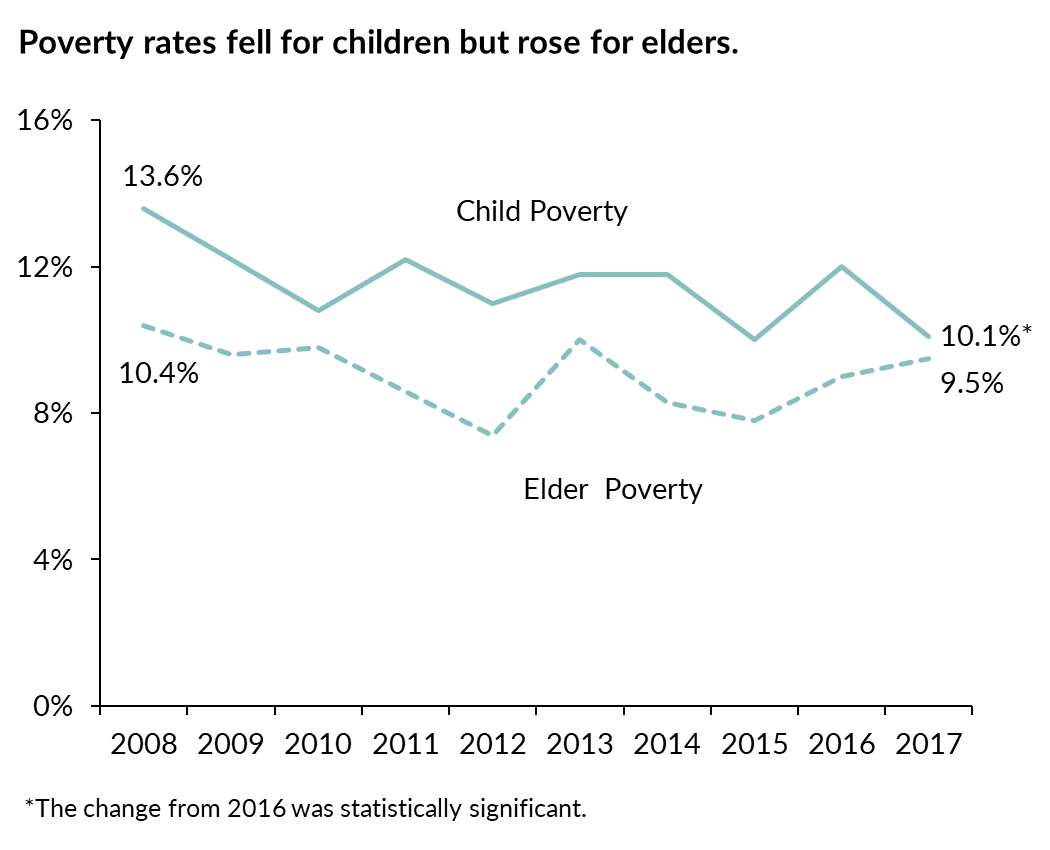
Poverty rates fell for children but rose for elders in 2017. The poverty rate for families with children fell from 12.0% to 10.1% between 2016 and 2017. This improvement appears to reflect a boost that families with children received from the economy, with parents possibly taking advantage of lower unemployment rates. Meanwhile, older Wisconsin residents (aged 65+), who are more likely to be out of the workforce, saw their poverty rates rise from 9.0% to 9.5% in 2017. This increase may in part be due to growing costs of living, including out-of-pocket medical expenses such as insurance premiums, co-payments for medical services, prescription and over-the-counter drugs, and uninsured medical expenses that present a significant challenge for the low-income elderly.
How Is Poverty Measured?
 This document reflects the Wisconsin Poverty Measure (WPM), developed by researchers at the Institute for Research on Poverty at the University of Wisconsin–Madison. The measure identifies whether families have the necessary income to meet their basic needs. It counts families’ market income and public cash benefits, in addition to noncash benefits (such as FoodShare) and tax credits. It also deducts necessary expenses such as childcare and medical expenditures and makes adjustments for geographic differences in prices.
The graph to the right shows the 2017 WPM rate of 10.2% is essentially unchanged from 2010 and 2012, the years of the immediate recovery from the Great Recession.
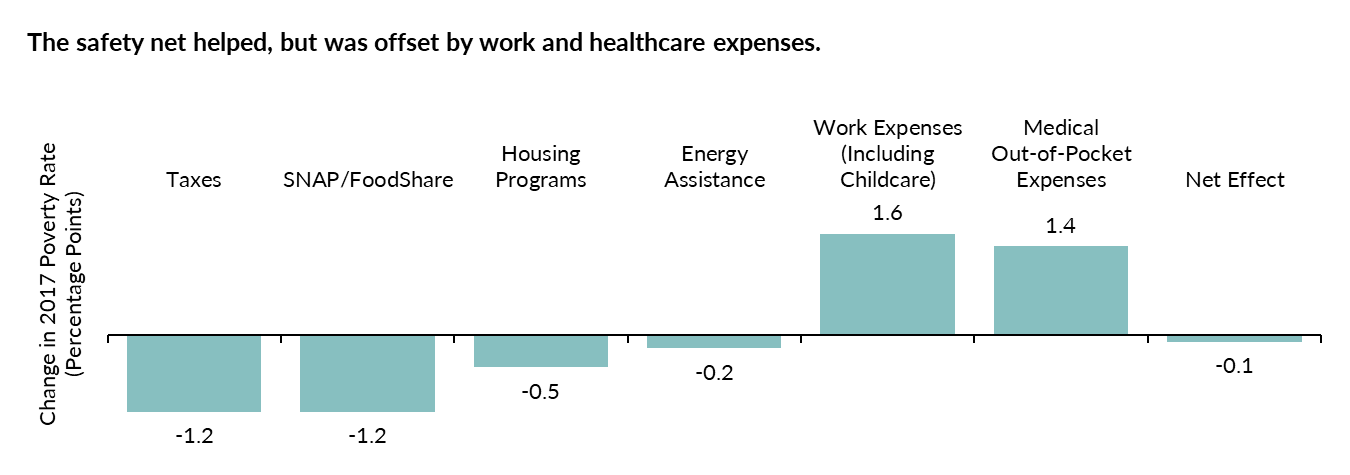
The Safety Net’s Important Role In Lifting People Out Of Poverty Is Shrinking
Tax credits and food assistance had a significant antipoverty impact in 2017, as shown below. Each lowered the poverty rate by 1.2 percentage points. Housing programs and energy assistance also had a protective effect and reduced the overall WPM poverty rate in the state by a total of 0.7 percentage points. Yet, the overall antipoverty impact of these programs was largely negated by work expenses (including childcare) and medical out-of-pocket expenses. In past years, particularly during the Great Recession, the safety net provided an important buffer against poverty, but its effects have shrunk over time as fewer people apply for and receive benefits. Benefit changes such as work requirements for single people in FoodShare have also reduced the number of people eligible to receive assistance.
 There Is Substantial Variation In Poverty Across The State
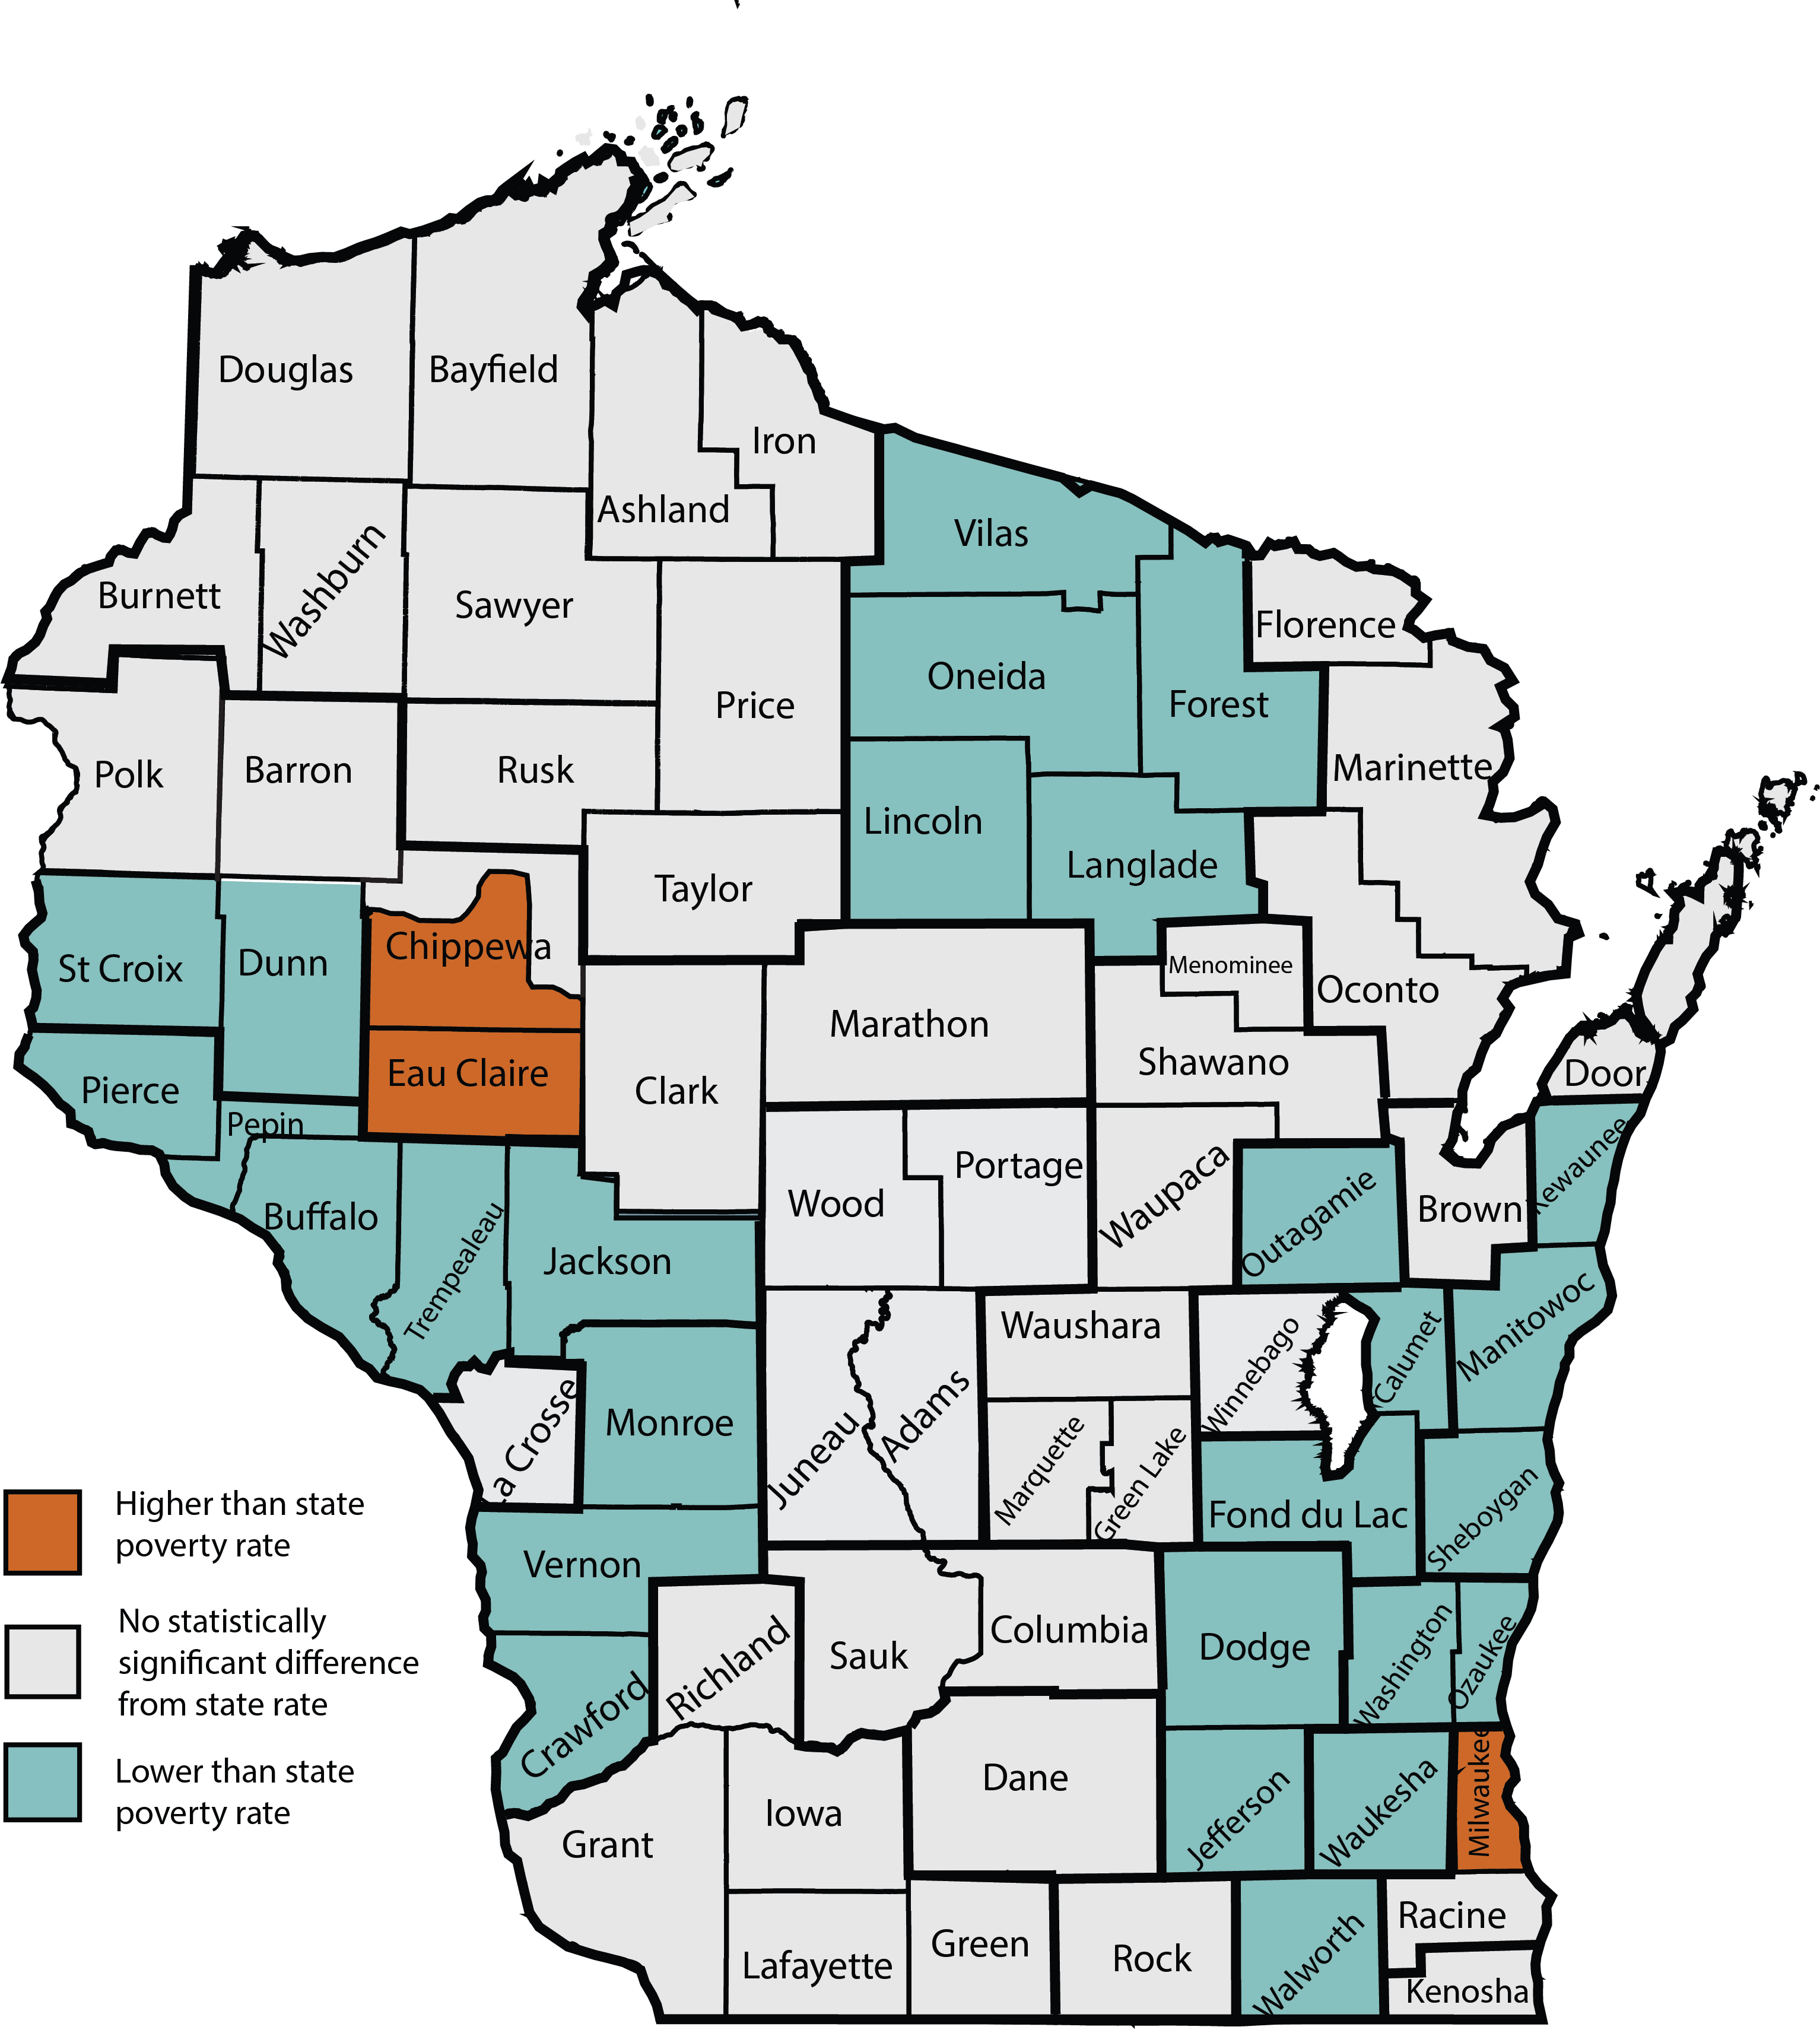 To understand how poverty varies across Wisconsin, the report estimates poverty for a number of counties and substate areas. Estimates for poverty rates are as low as 3.6% in Washington and Ozaukee counties and 4.2% in Waukesha County. On the other hand, the WPM rises to 17.2% in Milwaukee County and 14.4% in the area made up of Eau Claire and south Chippewa counties. These are the only places with rates significantly higher than the state average of 10.2%. These findings suggest that the economy is not benefitting workers and families evenly across our state.
There Is A Need To Combine Work With Supports
After more than eight years of nationwide recovery since the end of the Great Recession, we should see better poverty outcomes. While the long-term solution to poverty for the able-bodied non‑elderly, especially parents, is a secure job that pays well, falling income supports, the rising costs of childcare and medical care are offsetting the economic recovery in our state, despite our low unemployment rate. Even under the best of economic conditions, work alone does not solve the poverty problem for families with children, and increases in medical costs for older residents are outstripping increases in Social Security. If we want to lower poverty rates for vulnerable populations and do more than tread water, we need to maintain and even increase income support benefits and thereby better share the gains from economic growth in Wisconsin.
Categories
Poverty Measurement, State & Local Measures, WI Administrative Data Core, Wisconsin Poverty Reports